Predictive product segmentation that assigns your products to Google Shopping and PMax campaigns automatically.

Karsa.ai predicts the performance of each product every night and updates its custom_label in Google Merchant Center. Each campaign then contains products with similar predicted performance. You set a separate budget and Target ROAS for each one.

30-day free trial (nothing changes in your account until you map the supplemental feed) · Works via Google Merchant Center (custom_label) · Zero changes to store code

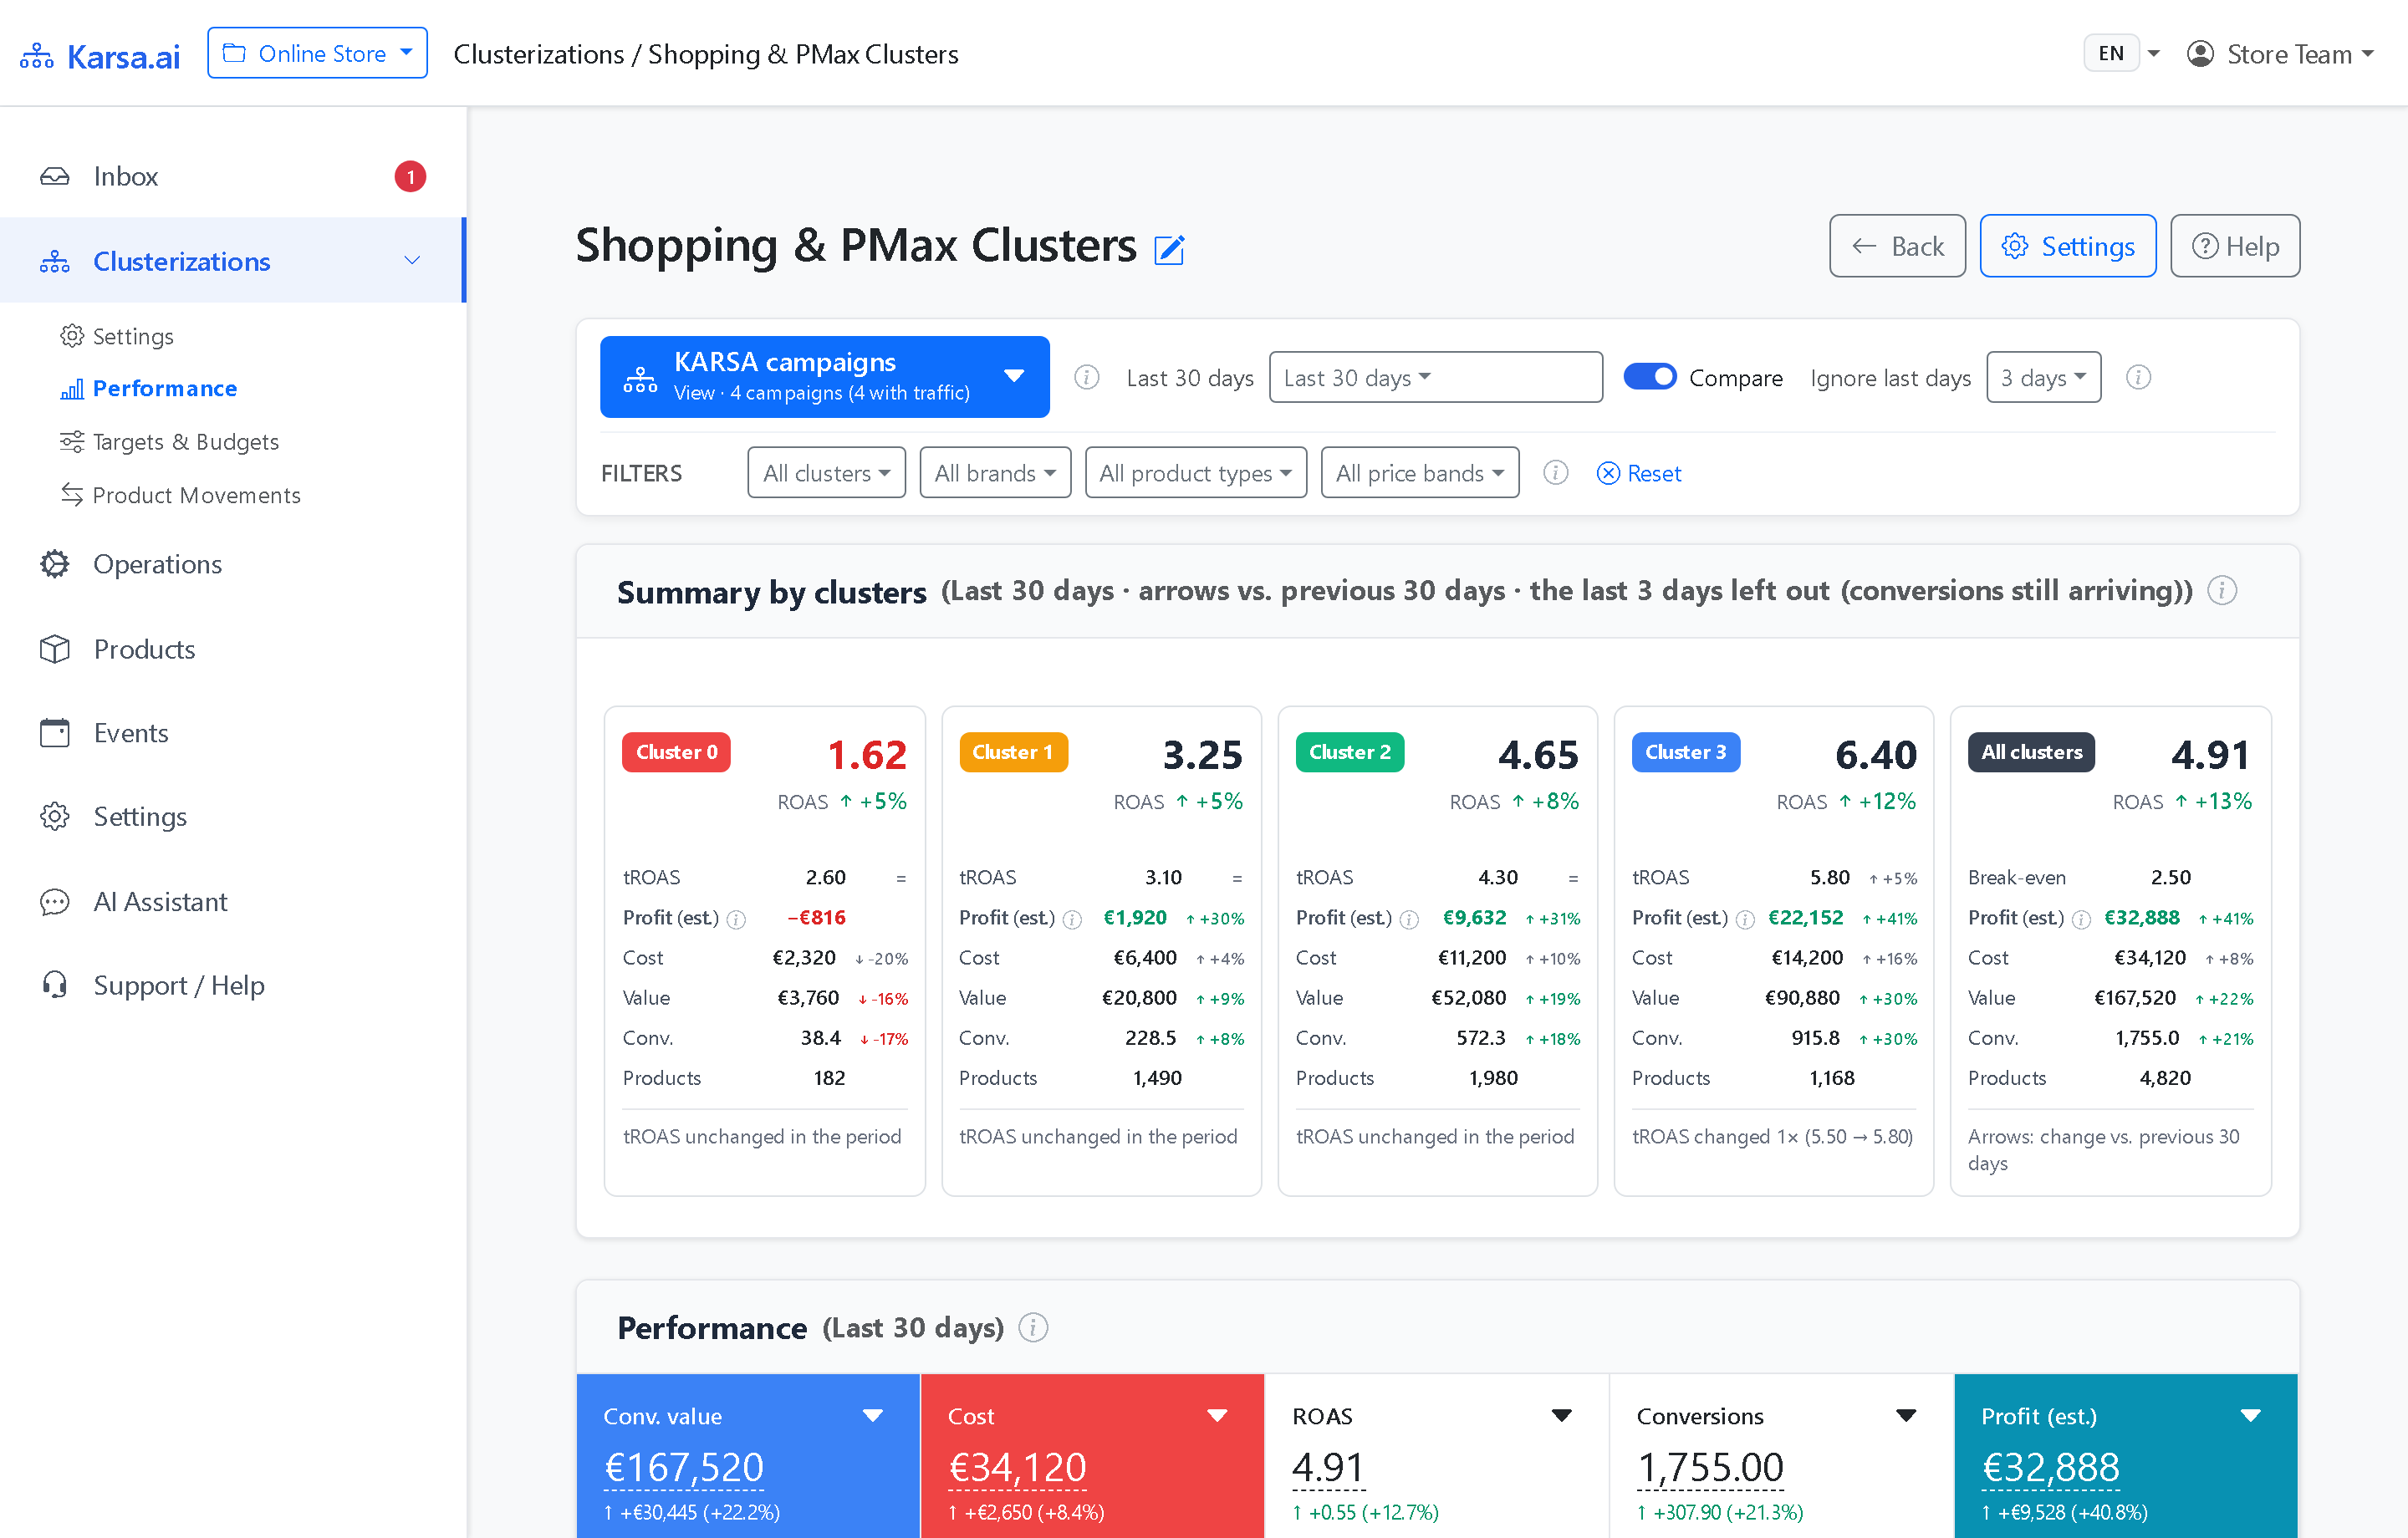
Karsa.ai Portal Summary by Clusters comparing Google Ads ROAS, Target ROAS, cost, conversion value, and estimated profit across dynamic performance clusters
Karsa.ai Portal Summary by Clusters comparing Google Ads ROAS, Target ROAS, cost, conversion value, and estimated profit across dynamic performance clusters.
Karsa.ai Portal Daily Performance chart with KPI tiles, conversion-lag shading, and Google Ads change markers
Daily performance curves and KPI summary in Karsa.ai Portal with conversion-lag window shading and campaign change markers.
Karsa.ai Portal Campaigns, Targets and Budgets table comparing Target ROAS, achieved ROAS, daily budget, estimated profit, and Search Impression Share across clusters
Campaigns, Targets and Budgets view in Karsa.ai Portal comparing Target ROAS, daily budget, estimated profit, and Search Impression Share across clusters.
Karsa.ai Portal Product Movements screen logging daily SKU transitions and post-promotion profit lift across clusters
Daily SKU movement KPIs, post-promotion profit impact, and daily movement bars inside Karsa.ai Portal.
Karsa.ai Portal Profit Calculation screen showing five supported margin and profit modes
Profit and Margin Calculation configuration in Karsa.ai Portal showing five supported margin modes.

1:1 Google Ads reconciliation across your dynamic performance clusters: compare ROAS, Target ROAS, estimated profit after ad spend, cost, conversion value, and active products.

Two problems, one fix

Two common Google Ads setups reduce profit. Karsa.ai fixes both.

One campaign gives top items and loss-making products the same budget and Target ROAS. Fixed brand and category campaigns do the same. Fixed 30-day rules react weeks too late. Karsa.ai predicts product performance every night and groups similar SKUs into separate campaigns.

✕ Problem 1 · Fixed Mixed Campaigns
Top, average, and loss-making products share the same fixed campaign budget and Target ROAS. Fixed mixed campaigns Shared budget · 1 Target ROAS

One or fixed campaigns for mixed SKUs

  • Top products hit the budget cap and lose Search Impression Share.
  • Loss-making products keep spending, and the average ROAS hides it.
✕ Problem 2 · Backward-Looking Rules
Product performance drops, while a backward-looking 30-day rule reacts weeks later after budget is already spent. Demand drops Rule reacts Reaction delay Trailing 30-day lookback window

Fixed product groups & 30-day rules

  • Rules look backward and react after the money is spent.
  • Rules react weeks late to seasonal shifts, price changes, and stockouts.
  • Hard ROAS cutoffs cause repeated moves that disturb Smart Bidding.
✓ With Karsa.ai · Nightly ML
Karsa.ai predicts product performance every night and routes SKUs into clean clusters. ML ↻ nightly Top ⋮ C1 C0

Nightly prediction & controlled moves

  • Predicts product performance across your catalog before seasonal demand shifts.
  • Fluidity Manager approves or blocks nightly updates via a supplemental feed (~5× fewer repeated moves vs. no guardrails).
Illustrative decomposition: what a mixed Google Ads campaign with a 450% Target ROAS hides REPORTED ROAS: 450% · SPEND ON LOSS-MAKING PRODUCTS: −€816
Mixed-Campaign Profit Breakdown Under a 450% Average Target ROAS Illustrative breakdown of a mixed Google Shopping or PMax campaign reporting 450% average ROAS and +3,164 EUR net profit: Top Products (C4) earn +2,600 EUR at 820% ROAS, Strong Products (C3) earn +1,120 EUR at 640% ROAS, Mid Catalog (C2) earns +260 EUR at 370% ROAS, while Low/No-Conversion Products (C1) lose -336 EUR at 175% ROAS and Loss-Making Products (C0) lose -480 EUR at 65% ROAS (-816 EUR combined loss). One shared Target ROAS covers profitable, zero-conversion (C1), and loss-making (C0) products Illustrative unsegmented campaign: C4–C2 earned +€3,980 while C1 + C0 lost −€816 (once separated, C1 gets its own profitable Target ROAS). +€2,400 +€1,600 +€800 €0 −€800 NET PROFIT / MARGIN (€) 800% 600% 400% 200% 0% ACHIEVED ROAS Campaign Average ROAS = 450% (Target Met) +€2,600 820% Top Cluster (C4) Top SKUs +€1,120 640% Strong Cluster (C3) High Return +€260 370% Mid Catalog (C2) Stable SKUs −€336 175% Low / No-Conv (C1) Unseparated Spend −€480 65% Loss-Making (C0) Loss-Making SKUs Potential: +€3,980 +€3,164 −€816 LOSS SPEND MIXED CAMPAIGN Reported ROAS = 450% 1. What the Google Ads report shows The campaign meets its 450% Target ROAS, so it looks healthy. 2. What the Karsa.ai breakdown of the same campaign shows Three clusters earned +€3,980. C1 and C0 lost €816 below break-even.
Top Cluster (C4)820% ROAS · capped by shared budget
+€2,600
Strong Cluster (C3)640% ROAS · high auction return
+€1,120
Mid Catalog (C2)370% ROAS · stable profitable baseline
+€260
Low / No-Conv (C1)175% ROAS · below break-even
−€336
Loss-Making (C0)65% ROAS · spends without return
−€480
Mixed Campaign Total (450% ROAS)+€3,980 profitable clusters minus −€816 loss spend
+€3,164
Illustrative decomposition of a mixed Google Ads campaign reporting 450% ROAS where profitable clusters generate +€3,980 and low/loss-making clusters lose −€816.
View mixed-campaign cluster decomposition table (illustrative example)
Product Group inside Mixed Campaign Achieved ROAS Net Profit (€) Auction Role
Top Cluster (C4)820%+€2,600Capped by shared campaign budget
Strong Cluster (C3)640%+€1,120High return, limited impression share
Mid Catalog (C2)370%+€260Stable profitable baseline
Low / Zero-Conversion (C1)175%−€336Below break-even ROAS
Loss-Making Products (C0)65%−€480Consumes budget below break-even
Mixed Campaign Total450%+€3,164 (vs. +€3,980)−€816 hidden loss spend
1. The number and structure of clusters adapt to your catalog The cluster count (for example 3, 5, or 8) depends on your conversion volume. Each active campaign keeps at least 30 conversions per 30 days. This requires about 100 or more Google Ads conversions per 30 days in the account. One account can also run multiple independent clusterizations in parallel. Examples are private-label vs. third-party brands, PLA vs. PMax, or separate product lines.
2. Compatible with brand and supplier budgets Keep co-op brand or supplier campaigns intact while Karsa.ai segments products by predicted performance inside each one.
How Karsa.ai improves Google Shopping and PMax performance

Three mechanisms that increase profit and conversion value.

Karsa.ai only reads your Google Ads account. It does not create campaigns and does not set bids. Every night it updates the custom_label of each product in Google Merchant Center. Your PPC specialist creates the campaigns for the clusters and sets their budgets and Target ROAS. Google Smart Bidding then bids inside each campaign.

1
Product Feed & Ads Data GMC XML feed + read-only Ads
2
ML Prediction Predicted performance per SKU
3
Homogeneous Clusters ≥ 30 conv. / 30d per active cluster
4
GMC Supplemental Feed Nightly custom_label update
5
Shopping & PMax Dedicated budget & Target ROAS
01 Top-performing cluster

Top products get their own dedicated budget

Dedicated budget → higher Search Impression Share → more conversion value
  • Products with the highest predicted performance move into a dedicated top campaign.
  • Average and loss-making items cannot spend this growth budget.
  • Top products enter more auctions and recover Impression Share lost to budget.
✕ Without Karsa.ai Shared cap limits top SKUs

Top, mid, and loss-making items draw from one daily budget.

✓ With Karsa.ai Dedicated top-cluster budget

Top SKUs get an isolated growth budget and recover Lost IS.

Mechanism 01: Shared daily budget capping top products versus dedicated cluster budget expanding Search Impression Share Left panel (Without Karsa.ai): One shared daily budget is split across top, mid, and loss-making SKUs, leaving top products with high Lost Impression Share due to budget. Right panel (With Karsa.ai): The top cluster receives a dedicated budget, raising Search Impression Share. ✕ WITHOUT KARSA.AI Shared Daily Campaign Budget Top Mid SKUs Loss Shared cap exhausted early in the day Impression Share of Top Products Captured Lost IS (budget) 0% 100% auctions High-return SKUs miss profitable clicks → ✓ WITH KARSA.AI Separate Budget per Cluster Top Growth Mid Weak Capped Impression Share of Top Products Unlocked Impression Share ↑ 0% 100% auctions Top SKUs capture full profitable demand
Illustrative mechanism comparison · Dedicated cluster budgets remove the shared budget ceiling on top-performing SKUs.
02 ≥ 30 conversions / 30d

Each campaign contains products that perform alike

Low-variance auction data → one Target ROAS matches every product
  • Google Smart Bidding estimates conversion rates from campaign-level data.
  • Grouping products with similar predicted performance cuts variance inside each campaign.
  • Cluster count adapts to your store so every active campaign keeps at least 30 conversions per 30 days.
✕ Without Karsa.ai High variance in fixed campaigns

One Target ROAS under-bids top items and over-bids weak ones.

✓ With Karsa.ai Homogeneous clusters (≥ 30 conv.)

Each cluster gets a Target ROAS that matches its products.

Mechanism 02: High-variance fixed campaign versus homogeneous Karsa.ai performance clusters on the same SKU distribution Top strip plot (Without Karsa.ai): Products from low to high predicted performance sit under one Target ROAS line that fits neither side. Bottom strip plot (With Karsa.ai): The identical products are separated into homogeneous bands C0 (optional), C1, Core, and Top tier, each with its own matching Target ROAS and at least 30 conversions per 30 days. ✕ WITHOUT KARSA.AI High variance inside fixed campaign: 1 Target ROAS fits neither side Blended tROAS ✓ WITH KARSA.AI Homogeneous clusters · Every active campaign ≥ 30 conv. / 30d C0 · optional C1 · Break-even Core · ≥30 conv Top · ≥30 conv Guardrail tROAS Strict tROAS Core tROAS Growth tROAS Low predicted product performance High predicted product performance
Illustrative distribution · Grouping SKUs by predicted product performance aligns each campaign’s Target ROAS with its items.
03 C1 weak · C0 optional

Weak and loss-making products get strict guardrails

Margin Break-Even Target ROAS + capped daily test budget · 0 SKUs removed
  • Low-performing products (C1) move to a separate guardrail campaign. Loss-making products can go to an optional C0 campaign.
  • You set a strict margin-derived Break-Even Target ROAS and a capped daily test budget.
  • All SKUs stay active in Merchant Center. When predicted performance improves, Karsa.ai moves them up.
✕ Without Karsa.ai Unrestricted spend below break-even

Loss-making items keep spending under a healthy-looking average ROAS.

✓ With Karsa.ai Guardrail campaigns (0 SKUs delisted)

Break-even Target ROAS + capped test budget; recovering SKUs move up.

Mechanism 03: Unrestricted daily spend on loss-making products versus capped daily test budget and Break-Even Target ROAS Left panel (Without Karsa.ai): 10 daily bars of unprofitable SKU spend rise high without a cap. Right panel (With Karsa.ai): A strict daily test budget cap and margin Break-Even Target ROAS cut off excess spend (shown as dashed saved outlines), while keeping all SKUs active in Merchant Center so recovering products move up. ✕ WITHOUT KARSA.AI Daily Spend on Loss-Making SKUs No spend cap below break-even ROAS 14-day spend hidden inside average ROAS Unprofitable clicks lower campaign profit → ✓ WITH KARSA.AI Weak Products Isolated with Guardrails Saved budget Moves up if demand rises Daily Budget Cap + Break-Even tROAS ✓ All SKUs stay in Merchant Center (0 delisted) Losses capped · Recovering SKUs promoted
Illustrative guardrail comparison · Break-Even Target ROAS and a capped test budget contain losses while keeping every SKU eligible to recover.

Products are grouped by predicted performance, not by margin

Karsa.ai uses machine learning to group SKUs by predicted product performance, keeping auction behavior uniform inside each campaign. Margins apply separately to set net profit and the break-even Target ROAS per cluster. The C0 group for loss-making items is optional.

Fluidity Manager: approves or blocks daily moves

The Fluidity Manager approves or blocks nightly transitions. Products can jump past adjacent clusters when performance shifts clearly. A dynamic post-move lock, stability buffer, and daily spend-share limit prevent back-and-forth churn. In 28-day tests, it cut repeated SKU moves by about 79% (almost 5× fewer) versus unguarded nightly reassignment.

Targets & Budgets · Portal analyses

Five analyses for Target ROAS and budget decisions, prepared in the Portal.

Google Ads provides the metrics, a bid strategy report, simulators, and change history as separate tools. Karsa.ai adds your product margins, conversion lag, and the normal fluctuation of your account. It shows the result per cluster, without exports or spreadsheets.

Per cluster · Margin break-even · Daily profit

Target vs. achieved ROAS & daily profit by cluster

Top row: Target ROAS, achieved 7-day ROAS, and the break-even ROAS from your margin, for each cluster. Recent days with incomplete conversions are shaded. Bottom row: daily profit after ad spend, with a red dashed line at each Target ROAS change.

Target vs. achieved ROAS & daily profit by cluster Tap or click to zoom ⤢
Target vs. achieved ROAS paired with daily profit by cluster showing margin break-even lines, conversion-lag shading, and Target ROAS change markers
Three Google Ads metrics · One 7-day view

Search impression share vs. Lost IS to rank & budget

Search impression share, lost impression share (rank), and lost impression share (budget) are shown as 7-day averages on one axis, from the day of the switch to production. This example shows 39% impression share, 25% lost to rank, and 36.0% lost to budget across 4 campaigns. When lost impression share due to budget rises above impression share, the daily budget limits the campaigns. This is a signal to review the budget or the Target ROAS.

Search impression share · 7-day average since switch to production Tap or click to zoom ⤢
Search impression share chart plotting 7-day Search IS (39%), Lost IS to rank (25%), and Lost IS to budget (36.0%) on one axis
7 days before vs. after · 90% noise band

How do campaigns react to a target change?

Karsa.ai evaluates every Target ROAS change with nothing else changed 7 days around it (here 20 clean changes out of 83 total). It compares the 7 days after with the 7 days before. It removes the trend of the whole account where the rest of the account allows it. The result is placed against the 90% range in which the account normally moves from week to week. A result inside this range cannot be separated from normal fluctuation.

How do campaigns react to a target change? Tap or click to zoom ⤢
Scatter chart and summary table evaluating 7-day cost, ROAS, COS, and daily profit reaction across 20 clean Target ROAS changes against the 90% noise band
60-day product ROAS and margin

What would a new target do?

Choose a candidate Target ROAS and see how the last 60 days of spend are distributed by actual product ROAS and margin. The view shows loss-making spend below the target. It also shows profitable products below the target whose conversion value and profit could be at risk. This view uses past product data. It is not a forecast of auction results.

What would a new target do? · 60-day product ROAS & margin distribution Tap or click to zoom ⤢
Target ROAS evaluation showing 60-day spend, conversion value, and profit across product ROAS buckets
14 days before vs. after · Compared with the rest of the account

Changes in Google Ads and what followed

Each Target ROAS and budget change is listed with the 14 days before and after. It is compared with the rest of the Google Ads account and with the usual fluctuation of the campaign. The table marks whether the change in ROAS is larger than normal fluctuation and whether conversions are still arriving.

Changes in Google Ads and what followed Tap or click to zoom ⤢
Changes in Google Ads and what followed table comparing 14-day before and after ROAS and cost against the rest of the account
Production study (Difference-in-Differences)

Case Study “Project D”: +26.6% conversion value and +16.5% ROAS with Karsa.ai.

Evaluation window: 47 days. Karsa.ai managed Google Standard Shopping across 4 cluster campaigns. A concurrent Performance Max campaign on the same catalog ran without Karsa.ai as the control group. Results are deseasonalized against the identical calendar days of the prior year.

+26.6%
Conversion Value
Net DiD lift vs. concurrent PMax control group, adjusted for prior-year seasonality.
+18.2%
Conversions
More completed orders from fewer clicks (−17.8% clicks vs. control).
+16.5%
ROAS
Higher conversion value relative to cost (+8.6% ad spend).
+36.4%
Profit After Ad Spend
Indicative profit after ad spend calculated at a 40% product margin.
Difference-in-Differences (DiD) Evaluation · Project D (47 Days) Control Group: Concurrent PMax · Deseasonalized

47-day Difference-in-Differences results: 4 Karsa.ai Shopping clusters vs. concurrent PMax control, adjusted for prior-year seasonality.

47-day production Difference-in-Differences comparison. Google Standard Shopping managed in 4 Karsa.ai clusters is compared with a concurrent Performance Max campaign on the same European online store catalog. Results are deseasonalized against the identical calendar days of the prior year.
Metric Shopping
with Karsa.ai vs. pre
PMax Control
same catalog
Active Diff
Shopping vs. PMax
Prior-Year Season
same days, no Karsa.ai
Karsa.ai DiD Lift
deseasonalized
Impressions +8.2% +1.1% +7.0% +11.1% −3.7%
Clicks +1.4% +33.7% −24.2% −7.8% −17.8%
CTR −6.3% +32.3% −29.1% −17.0% −14.6%
Ad Spend (Cost) +20.6% +20.1% +0.4% −7.6% +8.6%
Conversions +17.5% −15.9% +39.8% +18.2% +18.2%
Conversion Value +21.3% −2.6% +24.6% −1.6% +26.6%
ROAS +0.6% −18.9% +24.1% +6.5% +16.5%
Profit After Ad Spend (indicative at 40% margin) +21.9% −14.6% +42.7% +4.6% +36.4%
Weekly Shopping Conversion Value Index Active Season vs. Prior-Year Same Week
Active Shopping Prior-Year Same Week Karsa.ai Active (47 days)
Project D Weekly Google Shopping Conversion Value Index (Active Season vs. Prior-Year Baseline) During all six full weeks managed by Karsa.ai (W13 through W18), weekly Google Shopping conversion value index exceeded the identical calendar weeks of the prior year: W13 (134 vs 68), W14 (109 vs 74), W15 (80 vs 42), W16 (212 vs 92), W17 (177 vs 104), and W18 (189 vs 164); the 47-day window concludes with a 5-day partial week W19 (147 vs 314 full prior-year promo week). KARSA.AI ACTIVE (47 DAYS) W1W4W7W10W13W16W19W22
Active W1Karsa: 134Prior yr: 68
Active W2Karsa: 109Prior yr: 74
Active W3Karsa: 80Prior yr: 42
Active W4Karsa: 212Prior yr: 92
Active W5Karsa: 177Prior yr: 104
Active W6Karsa: 189Prior yr: 164
Active W7 (5d)Karsa: 147Prior yr (full wk): 314
Across all six full active weeks, Shopping conversion value exceeded the identical prior-year weeks (+26.6% full 47-day DiD lift). Full Project D methodology →
View weekly conversion value index data table (47-day evaluation window)
Evaluation Week Active Shopping Index (Karsa.ai) Prior-Year Same Week Index
Active Week 1 (W13)13468
Active Week 2 (W14)10974
Active Week 3 (W15)8042
Active Week 4 (W16)21292
Active Week 5 (W17)177104
Active Week 6 (W18)189164
Active Week 7 (W19, 5-day partial)147314 (full prior-year promo week)
Technical due diligence for PPC specialists

Three questions PPC teams ask before testing Karsa.ai.

Question 1 · Smart Bidding Stability

“How does Karsa.ai affect the Google Smart Bidding learning phase?”

One initial calibration, then protected updates. Initial cluster setup falls inside the 30-day free trial. Once live, the Fluidity Manager approves or blocks transitions, cutting repeated SKU moves by ~5× over 28 days versus unguarded reassignment.

Question 2 · Google Ads Control

“Will our team lose control of the Google Ads account?”

No. Karsa.ai works with read-only Google Ads user access, does not modify live bids or budgets, and only updates custom_label values in Merchant Center. Your team creates and manages all campaigns.

Question 3 · Store IT Workload

“Do we need our online store’s IT team for code changes?”

No. Zero changes to store code, checkout, or tags. You link one hosted supplemental XML feed URL in Google Merchant Center in ~10 minutes.

30-Day Free Trial · Portal Preview First

Inspect your predicted clusters in the Portal before going live.

Model training takes 1–2 days after you link your XML feed and read-only Google Ads access. Review the break-even ROAS and the spend of each cluster in the Portal before you map the supplemental feed.

Fixed annual & monthly pricing

A fixed price by catalog size. No commission on ad spend.

Every plan includes all features. Plans differ only by the number of active SKUs. Compare billing and FAQ →

Starter
Up to 10,000 active SKUs
€205 €164 / month
Billed annually (€1,968/yr · 20% off)
0% ad spend fee
All features included
  • ✓ Nightly SKU predictions
  • ✓ Supplemental feed for Merchant Center
  • ✓ All 5 profit and margin modes
  • ✓ Targets & Budgets analyses
  • ✓ Inbox reports and AI Assistant
Try for free
Growth
10,001–50,000 active SKUs
€310 €248 / month
Billed annually (€2,976/yr · 20% off)
0% ad spend fee
All features included
  • ✓ Nightly SKU predictions
  • ✓ Supplemental feed for Merchant Center
  • ✓ All 5 profit and margin modes
  • ✓ Targets & Budgets analyses
  • ✓ Inbox reports and AI Assistant
Try for free
Scale
50,001–100,000 active SKUs
€410 €328 / month
Billed annually (€3,936/yr · 20% off)
0% ad spend fee
All features included
  • ✓ Nightly SKU predictions
  • ✓ Supplemental feed for Merchant Center
  • ✓ All 5 profit and margin modes
  • ✓ Targets & Budgets analyses
  • ✓ Inbox reports and AI Assistant
Try for free
Custom
100,000+ active SKUs or multiple stores
Custom
Agencies & multi-country stores
Volume pricing
All features included, plus
  • ✓ Catalogs above 100,000 active SKUs
  • ✓ Several stores or domains in one agreement
  • ✓ Volume pricing for agencies
  • ✓ One login for all client projects
  • ✓ Agency Partner Program
Book a demo

Prices exclude VAT and are adjusted once a year for inflation. No commission on Google Ads spend. An active SKU is a unique product in your connected feed that is included in an active clusterization.

Start a 30-day free trial of Karsa.ai with your own product feed.

Connect your product XML feed and read-only Google Ads access, review your clusters in the Karsa.ai Portal, and run live for 30 days.

Try for free Book a demo
30-day free trial · Merchant Center supplemental feed (custom_label) · 0% commission on ad spend