Why naive "Before vs. After" PPC case studies mislead marketers
In retail Google Ads, comparing a post-launch window against a preceding baseline without a concurrent control mixes three forces together:
- Macro demand & auction shifts (competitor bidding, consumer demand, CPC inflation).
- Store-specific calendar seasonality (category demand shifting across consecutive weeks).
- The campaign intervention (predictive product segmentation).
To measure the production effect of Karsa.ai on Google Shopping revenue, Project D used a seasonally adjusted Difference-in-Differences (triple-difference) design on live Google Ads spend on a single European multi-thousand-SKU online store.
Experimental design of Project D
| Study Parameter | Specification |
|---|---|
| Store Profile | Mid-to-large European online store with multi-thousand-SKU Merchant Center catalog |
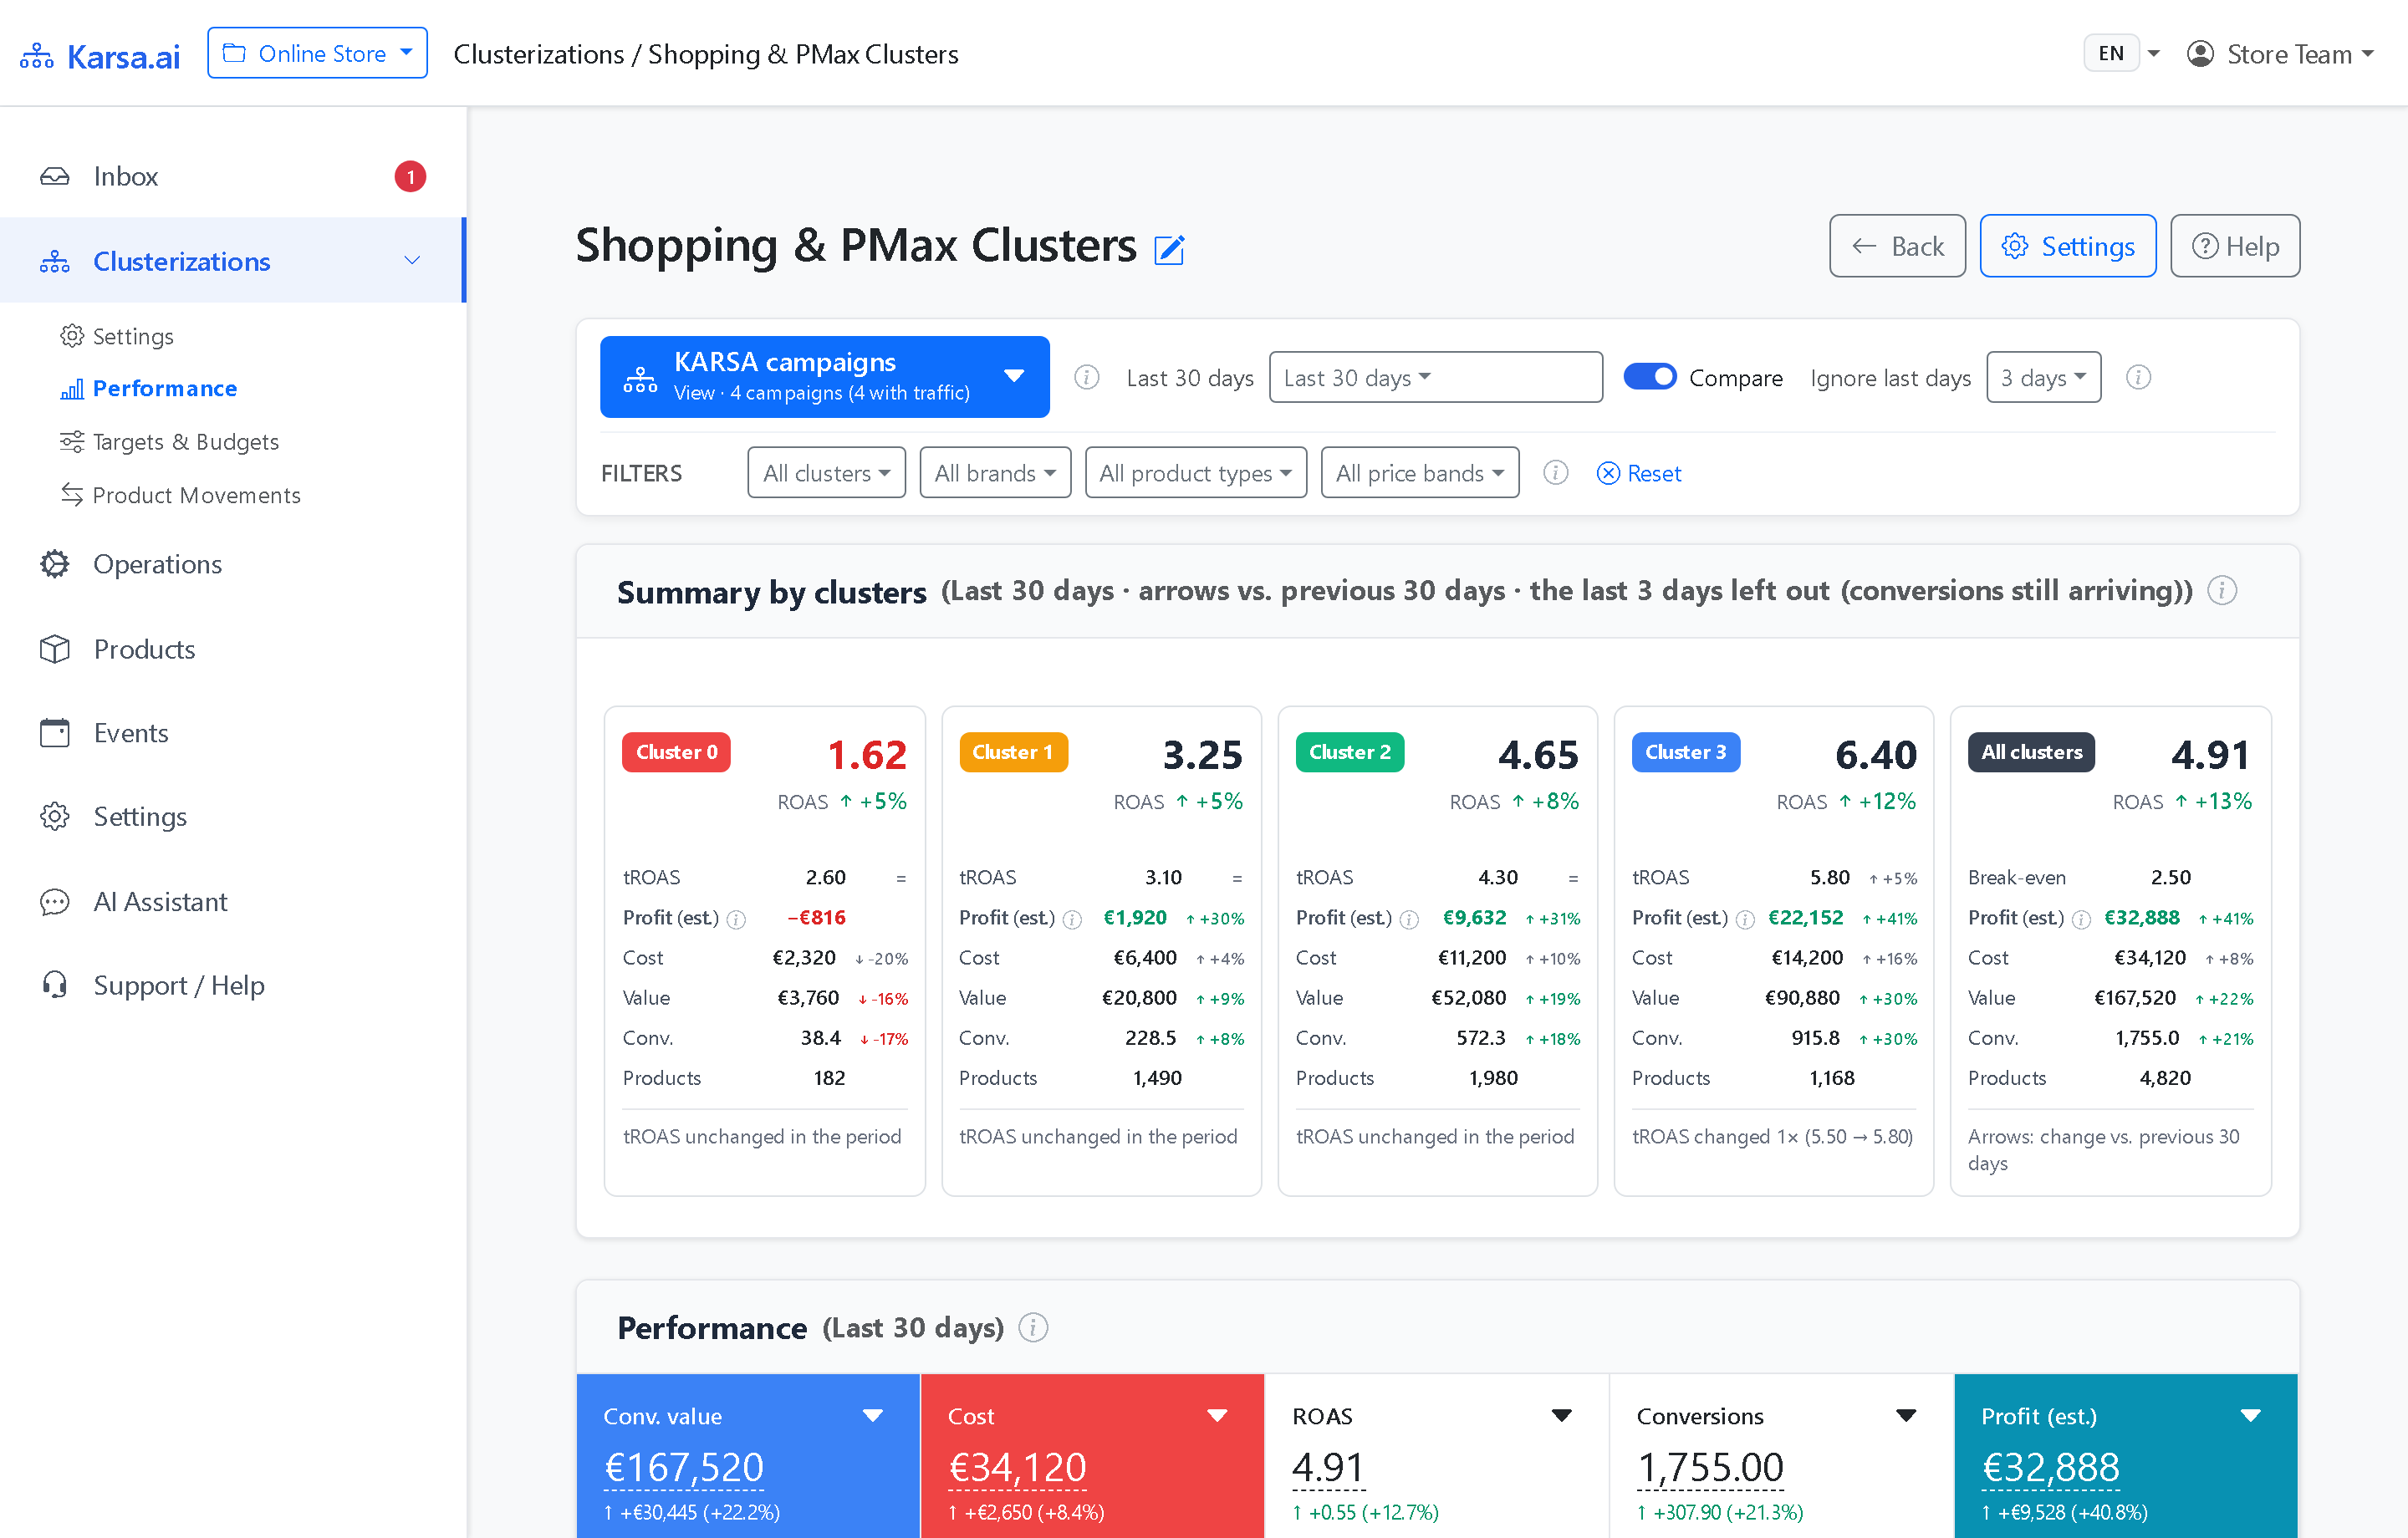
| Treatment Arm | Google Standard Shopping split into 4 dynamic Karsa.ai cluster campaigns via supplemental XML custom_label |
| Concurrent Baseline Arm | Google Performance Max campaign running concurrently on the same catalog without Karsa.ai |
| Active Treatment Window | 47 days of active cluster management (covering 6 full active weeks plus a 5-day partial Week 7) |
| Pre-Period Baseline | Preceding baseline window directly prior to cluster activation |
| Prior-Year Seasonal Control | Identical pre-period and 47-day calendar windows in the prior year (zero Karsa.ai involvement) |
Multiplicative seasonally adjusted Difference-in-Differences calculation
For each metric (Impressions, Clicks, CTR, Cost, Conversions, Conversion Value, ROAS, and Indicative Profit at a 40% product margin), let R_Shop_Study denote the post-vs-pre ratio of Google Shopping with Karsa.ai during the study period, and R_PMax_Study denote the post-vs-pre ratio of the concurrent PMax baseline:
- Active-Period Relative Differential (Shopping vs. Concurrent PMax):
Diff_Study = (R_Shop_Study / R_PMax_Study) − 1For Conversion Value:1.213 / 0.974 − 1 = +24.6%. - Prior-Year Seasonal Differential (Same Calendar Window, No Karsa.ai):
Diff_PriorYear = (R_Shop_PriorYear / R_PMax_PriorYear) − 1For Conversion Value:−1.6%. - Net Seasonally Adjusted DiD Estimate:
DiD_Karsa = ((1 + Diff_Study) / (1 + Diff_PriorYear)) − 1For Conversion Value:1.246 / 0.984 − 1 = +26.6%.
Mechanism breakdown: higher CPC in better auctions, higher conversion value
Inspecting cost, clicks, and conversions together clarifies the economic mechanism:
- Clicks fell (
−17.8%DiD) and CTR fell (−14.6%DiD) relative to the unsegmented PMax campaign, which expanded into+33.7%more low-converting clicks (−15.9%fewer conversions). - Ad spend rose
+8.6%DiD across−17.8%fewer clicks (implying roughly+32%higher average CPC): isolating weak SKUs stopped cheap, zero-return clicks and concentrated budget on competitive product auctions with stronger purchase intent. - Completed orders rose
+18.2%and conversion value rose+26.6%, more than paying for the higher CPC and lifting DiD-adjusted ROAS by+16.5%. - In all 6 full active weeks of Karsa.ai management (
Weeks 1–6), weekly Shopping conversion value exceeded the identical calendar week of the prior year (134 vs 68,109 vs 74,80 vs 42,212 vs 92,177 vs 104,189 vs 164). The 47-day DiD summary (+26.6%) includes the entire 47-day evaluation window, including the final 5-day partialWeek 7(147vs314during a prior-year promotional spike, which the concurrent PMax + prior-year DiD control accounts for directly).
Scope conditions and methodological limitations
- Single-store observational DiD: Project D reports live production data from one store rather than a multi-merchant randomized trial. That is why every Karsa.ai onboarding lets you inspect your store’s clusters in the Portal first (with zero account changes until you map the supplemental feed) and evaluate live performance during a 30-day free trial.
- Cross-campaign auction interaction & campaign format: Because segmented Standard Shopping and unsegmented Performance Max ran concurrently inside the same Google Ads account on the same catalog, auction spillover between the two campaigns cannot be fully separated without a geographic holdout split, and the active-period contrast reflects segmented Standard Shopping versus unsegmented PMax (controlled against the prior-year Shopping-vs-PMax baseline). Notice that even in raw post-vs-pre terms before subtracting PMax, Shopping conversion value grew
+21.3%(+17.5%conversions). - Indicative profit row (
+36.4%): Calculated at a standardized40%gross product margin (0.40 × Conversion Value − Ad Spend) to show net contribution sensitivity; store-level profit depends on each store’s actual gross margin. - Minimum conversion volume: Multi-cluster segmentation requires at least ~30 conversions per 30 days in each active cluster (
~100+monthly conversions for a 3-cluster setup, with600+monthly orders /20+daily orders recommended for 4–8 clusters); stores below ~100 monthly Google Ads conversions should remain in one consolidated campaign.
Frequently asked questions
Why did Project D combine a concurrent PMax baseline with a prior-year calendar-window comparison?
Simple before-and-after e-commerce case studies confuse seasonal demand shifts with software lift. Subtracting both the concurrent PMax change and the prior-year Shopping-vs-PMax differential over the identical calendar window (a seasonally adjusted DiD / triple-difference estimator) removes store-wide demand swings and recurring seasonal differences between campaign types.
Why did clicks decrease by 17.8% while spend rose by 8.6% and conversion value rose by 26.6%?
Suppressing low-intent SKUs in C0/C1 cut non-converting clicks, while shifting daily budget to top predicted clusters allowed Smart Bidding to win higher-intent product auctions at a roughly 32% higher average CPC — raising conversion rate and average order value enough to increase net ROAS by 16.5%.