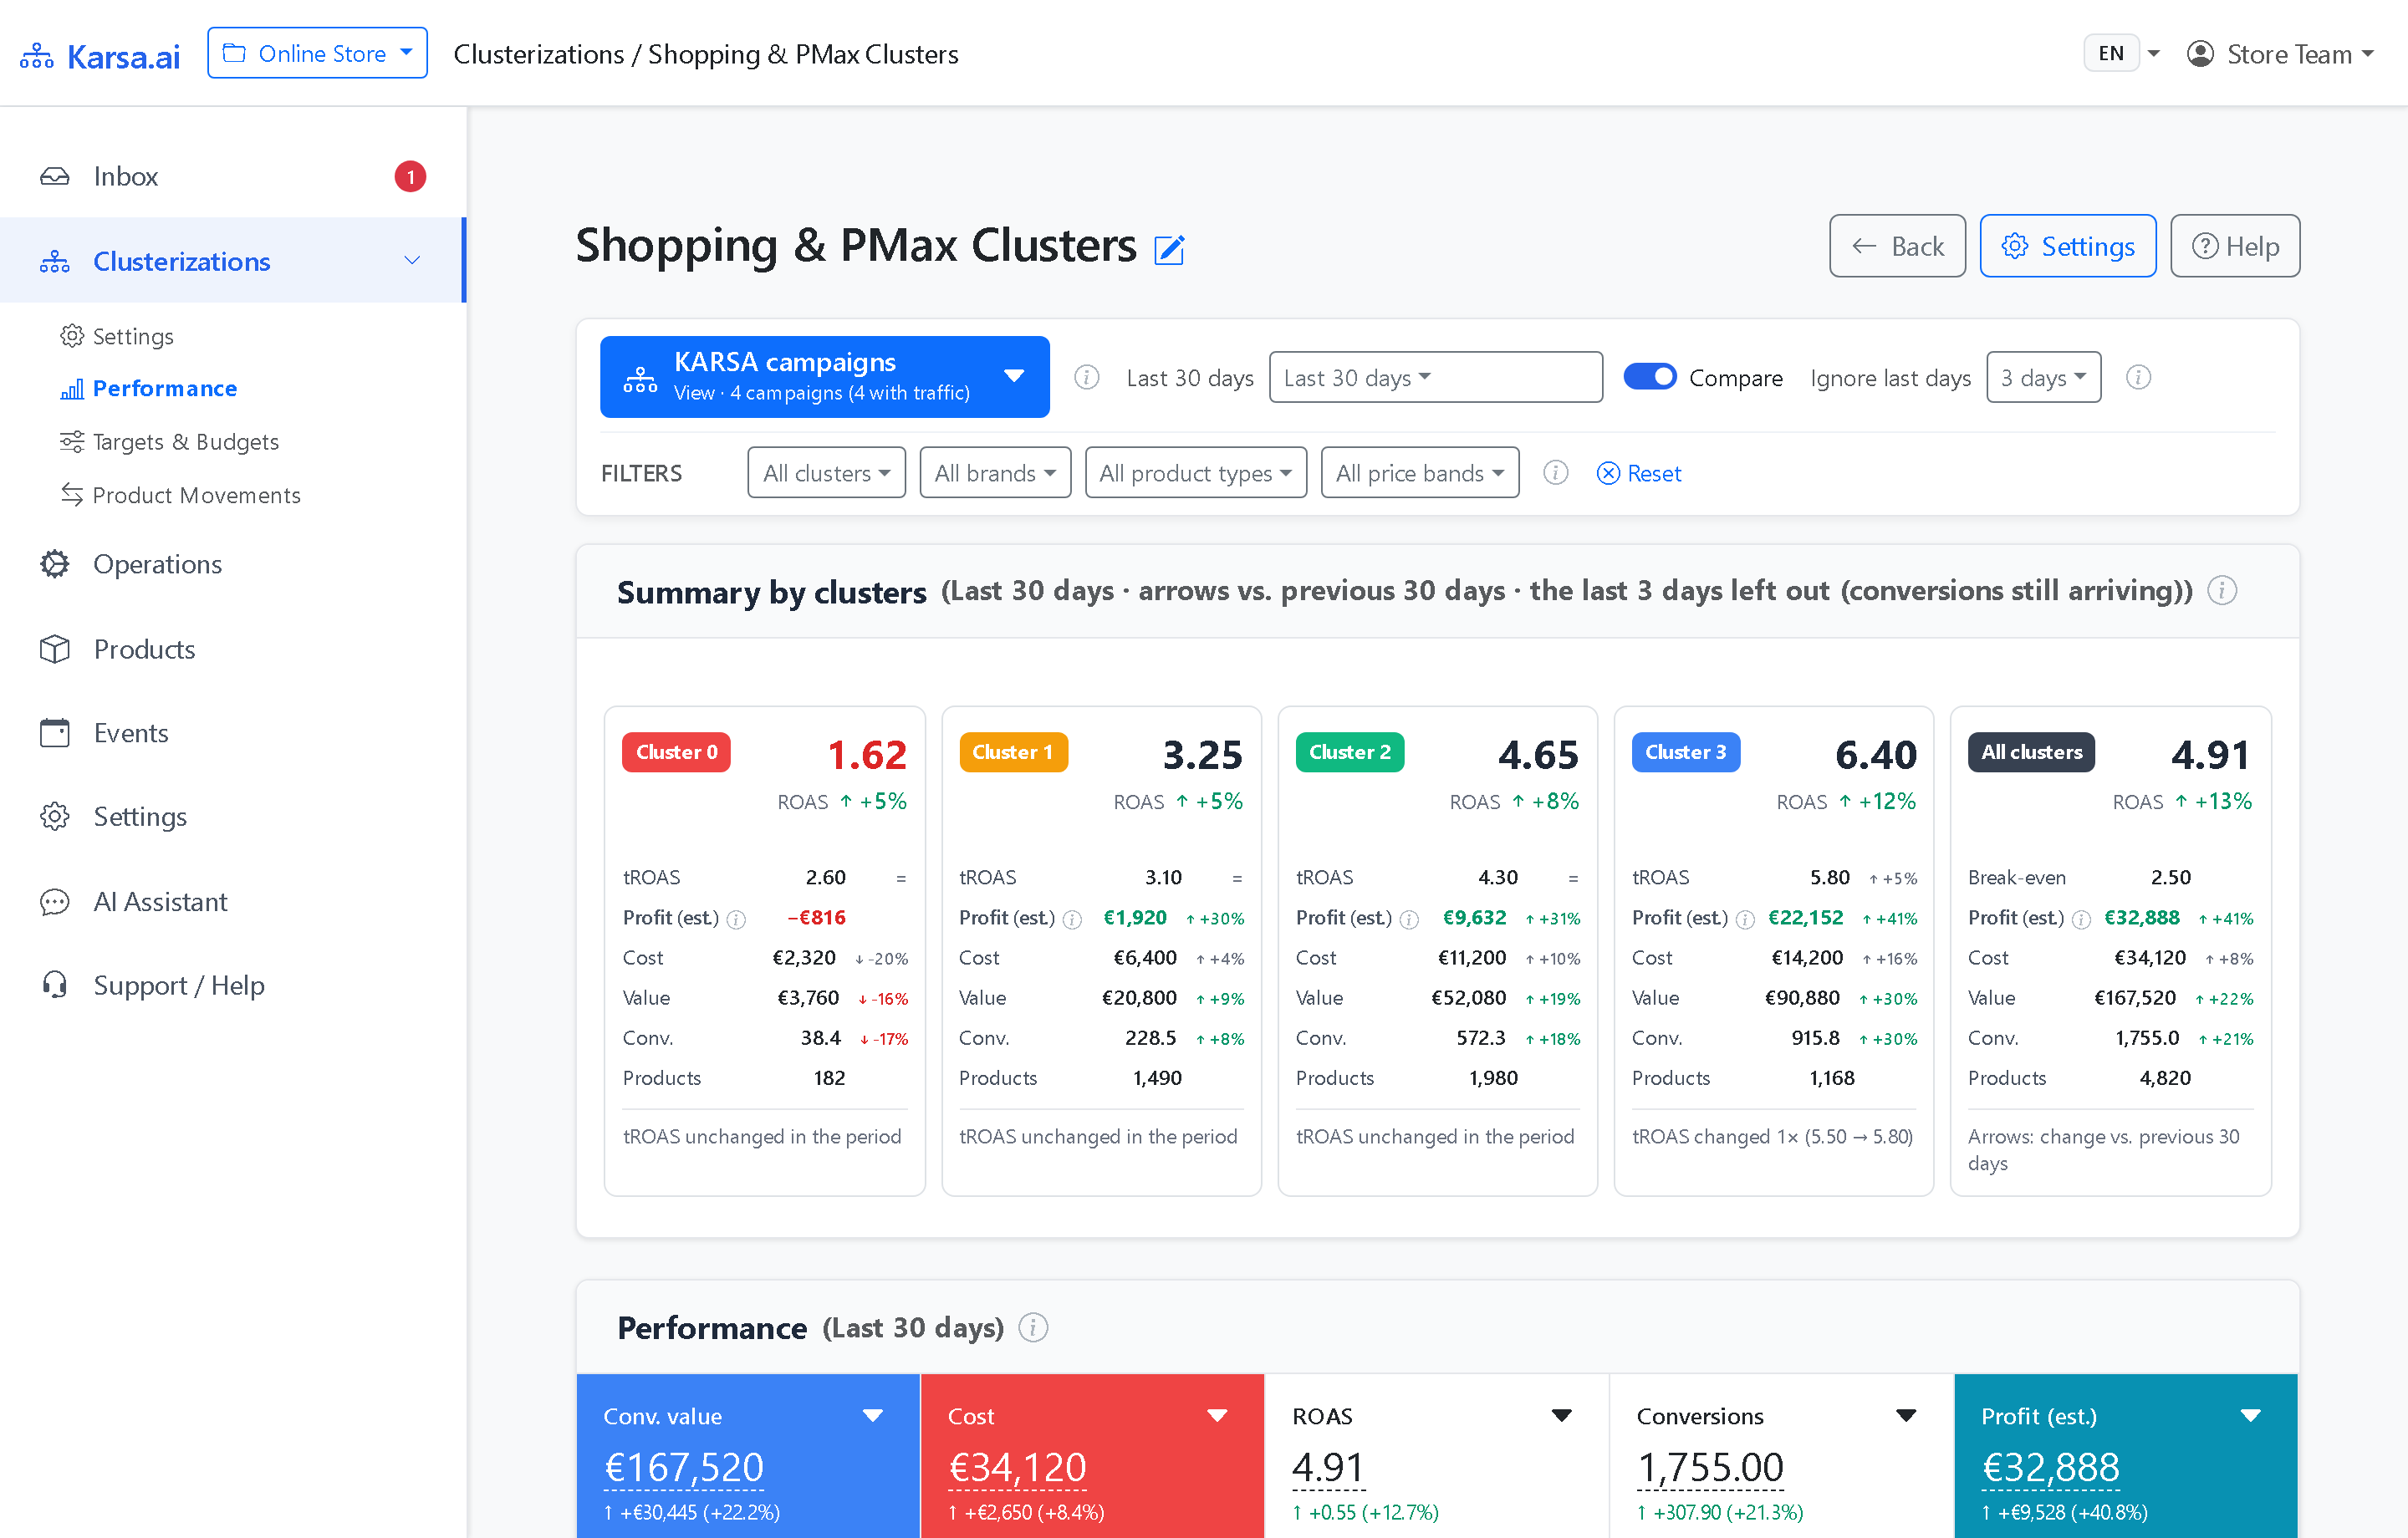
The stability trade-off in dynamic Google Shopping segmentation
Every dynamic custom_label setup faces a direct operational tension:
- If products never move, clusters go stale as seasonal demand, stock availability, and competitor pricing shift.
- If items shift on raw noise, borderline SKUs bounce between campaigns every few days and disturb auction bidding.
Karsa.ai resolves this tension with the Fluidity Manager, which approves or blocks transitions before writing your Google Merchant Center supplemental feed.
Four Fluidity Manager controls behind calm nightly updates
| Control Mechanism | Engineering Function | Operational Effect in Google Ads |
|---|---|---|
| 1. Direct Multi-Cluster Jumps | Lets a SKU skip intermediate groups in one step when predicted performance shifts clearly | Scales surging seasonal winners and isolates loss-making items fast without multi-week stepping delays |
| 2. Staggered Post-Move Lock | Holds relocated SKUs across a staggered lock window, with early release only on clear contrary evidence | Prevents back-and-forth bouncing right after reassignment and avoids synchronized waves of moves on one date |
| 3. Boundary Buffer & Evidence Check | Requires sustained evidence beyond normal boundary fluctuation before approving a reassignment | Filters out one-order spikes and borderline noise on low-volume catalog items |
| 4. Active Cluster Spend-Share Cap | Limits the share of trailing 30-day ad spend migrating out of or into active performance clusters overnight | Keeps campaign budgets and conversion volume steady from one auction day to the next |
Measured stability across production stores and 91-day benchmarks
Deploying these controls across active production stores cut daily SKU moves by 31% to 51% while preserving internal cluster homogeneity.
In a 91-day benchmark across three online stores against nightly threshold sorting, total moves fell by 42.5% (29% to 55% range). Reversals back to the previous cluster within 30 days dropped by one third, from 33.4% to 22.3% (−11.1 percentage points).
Full auditability in the Portal Product Movements view
PPC specialists never have to guess which products changed campaigns or whether reassignments helped net earnings. This workspace breaks transition diagnostics into four clear views.
1. Transition matrix and six-month volume stability
The Where products moved matrix cross-tabulates every origin and destination cluster over your selected 7-, 14-, or 30-day window. Off-diagonal cells highlight upward shifts (▲) and downward steps (▼), while the Out column and row separate feed removals and new arrivals from real reassignments.
Beside it, Moves per month plots half-year stacked bars across upward shifts, downward steps, Cluster 0 entries or exits, and feed departures. Healthy accounts maintain balanced upward and downward flow without sudden volume spikes.

2. Cohort before-and-after impact (How do products react to a move?)
Evaluating relocated items purely on raw before-and-after totals can mislead during seasonal swings. How do products react to a move? compares per-SKU daily averages across two weeks after each transition against the prior fortnight.

Look at the rightmost column, Profit change vs. stayed:
- Upward cohorts (
▲): Measures whether promoted items gained more net profit per day than peer SKUs remaining in the origin cluster on identical dates. Notice direct breakout jumps (C1 → C3 ▲) alongside single-step climbs. - Cooling demotions (
▼): Seasonal items stepping down (C3 → C2 ▼) naturally cool relative to thriving peers left behind. Lower ad spend cushions that decline. - Unprofitable SKU isolation (
C1 → C0 ▼): Cutting ad spend on chronic non-earners turns negative daily profit positive, generating strong net gain versus staying put.
3. Promotion payoff verdict and searchable Latest moves
- Do promotions pay off? Summarizes your primary upward flow into a direct
Yes,Partly, orNobadge using latest SKU margins. - Latest moves: Provides instant search by product title or offer ID. Switch between settled transitions (
two weeks after) and newest reassignments (7+ dayselapsed).
Frequently asked questions
What happens if a product records one lucky high-value order yesterday?
One outlier order does not trigger an erratic jump followed by a quick drop. Karsa.ai combines smoothed predictions with boundary buffers, historical evidence checks, and a staggered lock. Genuine breakouts still jump across multiple clusters without artificial single-step delays.
Can PPC specialists inspect which SKUs changed clusters and how they reacted?
Yes. Open Product Movements in the Karsa.ai Portal to review the 7-, 14-, or 30-day transition matrix and monthly chart. Inspect cohort results in How do products react to a move? and check the Yes / Partly / No promotion verdict. You can also search individual offer IDs inside the Latest table.