Product Module · Why Clustering Improves Results

Why & Where Google Ads Performance Improves with Karsa.ai

One campaign gives every product the same budget and Target ROAS. Karsa.ai sorts SKUs into clusters by predicted performance for separate control.

Direct Answer · Key Summary

Karsa.ai predicts the performance of every product each night and groups similar items into clusters. You run one Google Ads campaign per cluster. Results improve in three ways: top products receive a dedicated budget, Smart Bidding learns from uniform campaigns, and weak items face strict limits.

The short version

  1. One campaign holds very different products, yet shares a single daily budget and Target ROAS.
  2. Every night, Karsa.ai predicts product performance across your catalog and groups similar SKUs into clusters.
  3. You run one campaign per cluster, giving each group a dedicated budget and matching Target ROAS.
✕ Without Karsa.ai High variance in fixed campaigns

One Target ROAS under-bids top items and over-bids weak ones.

✓ With Karsa.ai Homogeneous clusters (≥ 30 conv.)

Each cluster gets a Target ROAS that matches its products.

Mechanism 02: High-variance fixed campaign versus homogeneous Karsa.ai performance clusters on the same SKU distribution Top strip plot (Without Karsa.ai): Products from low to high predicted performance sit under one Target ROAS line that fits neither side. Bottom strip plot (With Karsa.ai): The identical products are separated into homogeneous bands C0 (optional), C1, Core, and Top tier, each with its own matching Target ROAS and at least 30 conversions per 30 days. ✕ WITHOUT KARSA.AI High variance inside fixed campaign: 1 Target ROAS fits neither side Blended tROAS ✓ WITH KARSA.AI Homogeneous clusters · Every active campaign ≥ 30 conv. / 30d C0 · optional C1 · Break-even Core · ≥30 conv Top · ≥30 conv Guardrail tROAS Strict tROAS Core tROAS Growth tROAS Low predicted product performance High predicted product performance
Illustrative distribution · Grouping SKUs by predicted product performance aligns each campaign’s Target ROAS with its items.

The problem: one campaign reports a single average

An online store often places thousands of SKUs into one Google Shopping or Performance Max campaign. Fixed brand and category setups behave the same way because Smart Bidding optimizes toward one campaign Target ROAS.

Reports display one blended average, which can meet your target while individual items perform very differently:

  • Top products hit the shared budget cap. They compete for daily spend against every weaker item in the catalog.
  • Loss-making products continue spending. Strong sellers lift the campaign average above target, hiding unprofitable clicks underneath.
What the report shows 450% ROAS, target met

One average for the whole campaign.

Inside the same campaign Two product groups lost €816

Top products reached 820% ROAS. Loss-making products reached 65%.

Achieved ROAS by product group inside one campaign with a 450% average Illustrative example. One campaign reports 450% ROAS and meets its target. Inside it, top products reach 820% ROAS and earn 2,600 EUR, strong products reach 640% and earn 1,120 EUR, the mid catalog reaches 370% and earns 260 EUR, weak products reach 175% and lose 336 EUR, and loss-making products reach 65% and lose 480 EUR. Achieved ROAS by product group inside one campaign Top products Strong products Mid catalog Weak products Loss-making products 820% · +€2,600 640% · +€1,120 370% · +€260 175% · −€336 65% · −€480 Campaign average: 450% ROAS The report shows 450% and a met target. It does not show that two groups lost €816.
Illustrative example · One campaign average covers product groups from 65% to 820% ROAS.

Why a fixed 30-day window does not fit every product

Static groups by category, brand, or margin stay frozen when demand shifts with prices, stock, promotions, and seasons.

Historical label scripts instead apply a fixed cutoff such as "ROAS above 400% over the last 30 days". That single lookback works for steady everyday sellers, yet fails whenever an item follows a different buying rhythm:

1. Steady seller (frequent weekly orders)
30-day rule: Reads regular sales accurately. Karsa.ai ML: Holds SKU in top cluster.
2. Longer cycle (every 5–6 weeks)
30-day rule: Hits empty gap and demotes. Karsa.ai ML: Predicts demand, keeps cluster.
3. Ended season (demand stopped 2 weeks ago)
30-day rule: Counts past sales, keeps spending. Karsa.ai ML: Spots drop-off and moves down.
4. Rising demand (new season starting)
30-day rule: Below cutoff, misses early peak. Karsa.ai ML: Catches surge and promotes sooner.
Fixed 30-day rule versus Karsa.ai ML prediction across four product sales cycles Illustrative comparison across four catalog sales cycles. 1. Steady seller: 30-day rule reads accurately, while Karsa.ai ML holds the top cluster. 2. Longer cycle (every 5 to 6 weeks): 30-day rule hits an empty gap and demotes, while ML keeps the active cluster. 3. Ended season: 30-day rule counts old sales and overspends, while ML spots the drop-off early. 4. Rising demand: 30-day rule misses the early peak, while ML catches momentum and promotes sooner. Why a 30-day window misreads SKUs: fixed rule vs. ML prediction PRODUCT PATTERN Earlier sales Last 30d 30-DAY RULE KARSA.AI ML 1. Steady seller Sells every few days ✓ Accurate read Keeps active cluster ✓ Holds top cluster Steady prediction 2. Longer cycle Sells every 5–6 wks ✕ Empty 30d gap Wrongly demotes ✓ Predicts cycle Stays in cluster 3. Ended season Demand stopped 2w ago ✕ Old sales count Over-spends late ✓ Spots drop-off Moves down early 4. Rising demand New peak just started ✕ Below 30d bar Misses early peak ✓ Catches surge Promotes sooner Earlier -30d Today One 30-day cutoff only fits steady sellers. ML predicts performance across every cycle.
Illustrative example · How a fixed 30-day lookback rule and Karsa.ai ML prediction handle four catalog sales cycles.
  • Longer purchase cycles look inactive: An item bought every five to six weeks can show zero 30-day orders and get demoted.
  • Ended seasons keep spending: Past peak orders remain inside the 30-day count for weeks after demand drops.
  • Rising demand waits in a low cluster: Early orders take weeks to pass a 30-day cutoff, missing peak auctions.

Shortening the lookback adds daily noise for slower items, while lengthening it slows reaction to seasonal shifts. Splitting rules by fast, slow, and seasonal items creates dozens of manual cutoffs to maintain. Karsa.ai replaces fixed lookback rules with machine-learning models that predict product performance directly from your store data.

Method Products are grouped by Limit
Single or category campaigns Catalog taxonomy One blended average across unequal SKUs
Margin buckets Gross margin % Identical margins still convert very differently
30-day rule scripts Fixed lookback window and static cutoffs One time window misreads different buying cycles
Karsa.ai Nightly predicted product performance Requires roughly 100+ monthly Google Ads conversions

What Karsa.ai does instead

Every night, Karsa.ai predicts future performance for each SKU in your feed, including items with sparse clicks. Items with similar predicted performance join the same cluster, keeping auction behavior consistent inside every campaign.

Cluster count adapts to your account volume so each active campaign retains at least 30 monthly conversions. Typical accounts run 3 to 8 active groups, and one workspace can maintain multiple independent clusterizations in parallel.

Product margin never decides cluster placement. Instead, it calculates net profit and sets the break-even Target ROAS per cluster.

Karsa.ai updates only custom_label values via a Google Merchant Center supplemental feed while your team controls bids and budgets.

The optional C0 cluster

C0 is an optional cluster for chronically loss-making products. You enable it per clusterization, because isolating unprofitable SKUs into a separate campaign does not pay off in every account. When C0 stays off, Karsa.ai assigns all items to active clusters based on predicted performance.

Three places where performance improves

1. Top products receive a dedicated budget

SKUs with the highest predicted performance enter the top cluster, where a separate daily budget protects Search Impression Share.

✕ Without Karsa.ai Shared cap limits top SKUs

Top, mid, and loss-making items draw from one daily budget.

✓ With Karsa.ai Dedicated top-cluster budget

Top SKUs get an isolated growth budget and recover Lost IS.

Mechanism 01: Shared daily budget capping top products versus dedicated cluster budget expanding Search Impression Share Left panel (Without Karsa.ai): One shared daily budget is split across top, mid, and loss-making SKUs, leaving top products with high Lost Impression Share due to budget. Right panel (With Karsa.ai): The top cluster receives a dedicated budget, raising Search Impression Share. ✕ WITHOUT KARSA.AI Shared Daily Campaign Budget Top Mid SKUs Loss Shared cap exhausted early in the day Impression Share of Top Products Captured Lost IS (budget) 0% 100% auctions High-return SKUs miss profitable clicks → ✓ WITH KARSA.AI Separate Budget per Cluster Top Growth Mid Weak Capped Impression Share of Top Products Unlocked Impression Share ↑ 0% 100% auctions Top SKUs capture full profitable demand
Illustrative mechanism comparison · Dedicated cluster budgets remove the shared budget ceiling on top-performing SKUs.

2. Smart Bidding learns from uniform campaigns

For low-click SKUs, Google Smart Bidding relies on campaign-level conversion data. Grouping items with similar predicted performance gives every campaign a clean signal, so one Target ROAS fits all included SKUs.

3. Weak products stay behind strict guardrails

You keep your entire catalog active in Merchant Center without hard exclusions. Low-performing items move into C1 (or optional C0) under a break-even Target ROAS and a capped daily budget. Once predicted performance recovers, Karsa.ai promotes the SKU back into a higher cluster overnight.

✕ Without Karsa.ai Unrestricted spend below break-even

Loss-making items keep spending under a healthy-looking average ROAS.

✓ With Karsa.ai Guardrail campaigns (0 SKUs delisted)

Break-even Target ROAS + capped test budget; recovering SKUs move up.

Mechanism 03: Unrestricted daily spend on loss-making products versus capped daily test budget and Break-Even Target ROAS Left panel (Without Karsa.ai): 10 daily bars of unprofitable SKU spend rise high without a cap. Right panel (With Karsa.ai): A strict daily test budget cap and margin Break-Even Target ROAS cut off excess spend (shown as dashed saved outlines), while keeping all SKUs active in Merchant Center so recovering products move up. ✕ WITHOUT KARSA.AI Daily Spend on Loss-Making SKUs No spend cap below break-even ROAS 14-day spend hidden inside average ROAS Unprofitable clicks lower campaign profit → ✓ WITH KARSA.AI Weak Products Isolated with Guardrails Saved budget Moves up if demand rises Daily Budget Cap + Break-Even tROAS ✓ All SKUs stay in Merchant Center (0 delisted) Losses capped · Recovering SKUs promoted
Illustrative guardrail comparison · Break-Even Target ROAS and a capped test budget contain losses while keeping every SKU eligible to recover.

Discounts affect strong and weak clusters differently

A price cut affects strong and weak clusters in opposite ways, which static margin labels miss.

  • Top clusters: Lower unit margin raises break-even ROAS, yet higher conversion rates can still grow total daily profit.
  • Weak clusters: Lower margin rarely brings enough extra orders, so Karsa.ai raises the break-even floor overnight to guide a stricter target.

Where you see it in the Portal

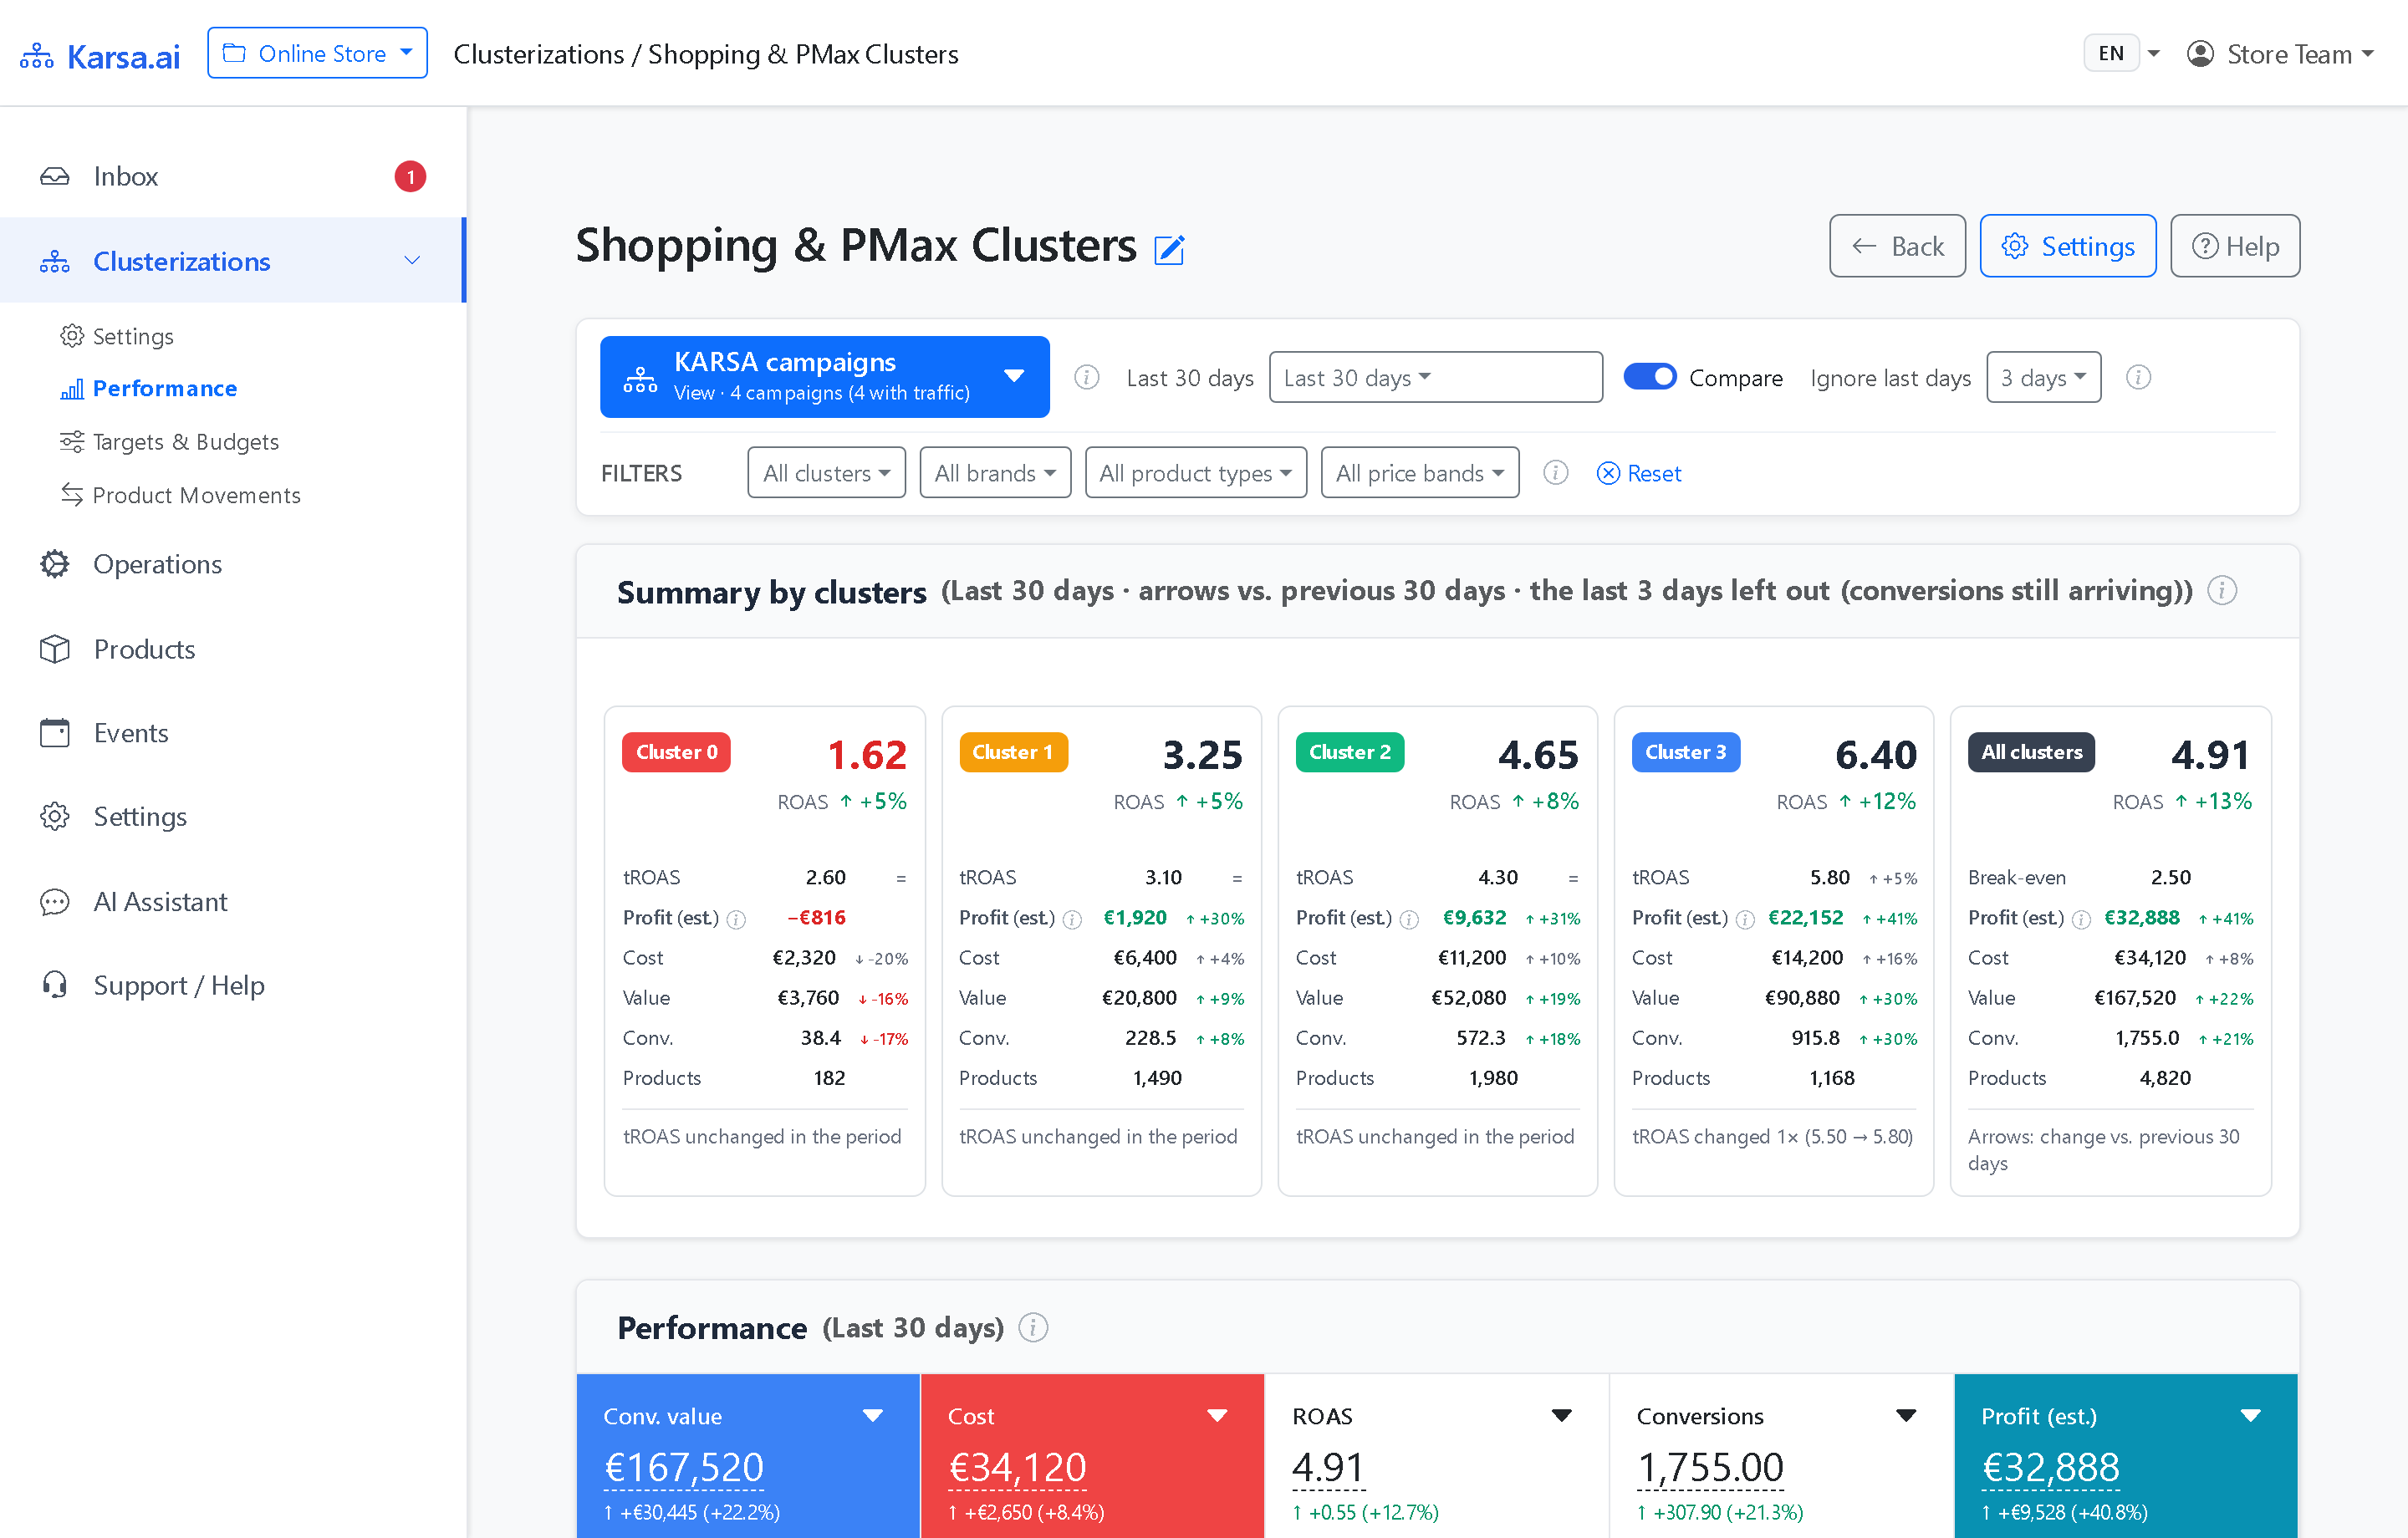
The Portal displays achieved return, Target ROAS, cost, conversion value, and net profit per cluster before your feed goes live.

Karsa.ai Portal View Click to inspect ⤢
Karsa.ai Portal Summary by Clusters reconciling Google Ads ROAS, cost, conversion value, and net profit
Karsa.ai Portal Summary by Clusters comparing return, Target ROAS, cost, conversion value, and net profit per campaign.

Frequently asked questions

Does Karsa.ai group products into clusters according to margin?

No. Karsa.ai groups SKUs by predicted product performance, so items inside one campaign behave similarly during auctions. Margin applies separately to set the conversion threshold, net profit, and the break-even Target ROAS of each cluster.

Why can a 30-day rule not do the same job?

A rule relies on one fixed lookback window, and no single period fits your entire catalog. Thirty days works for a steady seller, yet misreads longer buying cycles and seasonal shifts. Machine-learning prediction spots changing product performance early without manual threshold maintenance.

Is the C0 cluster required?

No. C0 is an optional group for loss-making products, enabled only where isolating unprofitable spend pays off. When C0 is disabled, Karsa.ai assigns every SKU to an active cluster by predicted performance.
Start a 30-day free trial of Karsa.ai with your own product feed.

Connect your product XML feed and read-only Google Ads access, review your clusters in the Karsa.ai Portal, and run live for 30 days.

Try for free Book a demo
30-day free trial · Merchant Center supplemental feed (custom_label) · 0% commission on ad spend