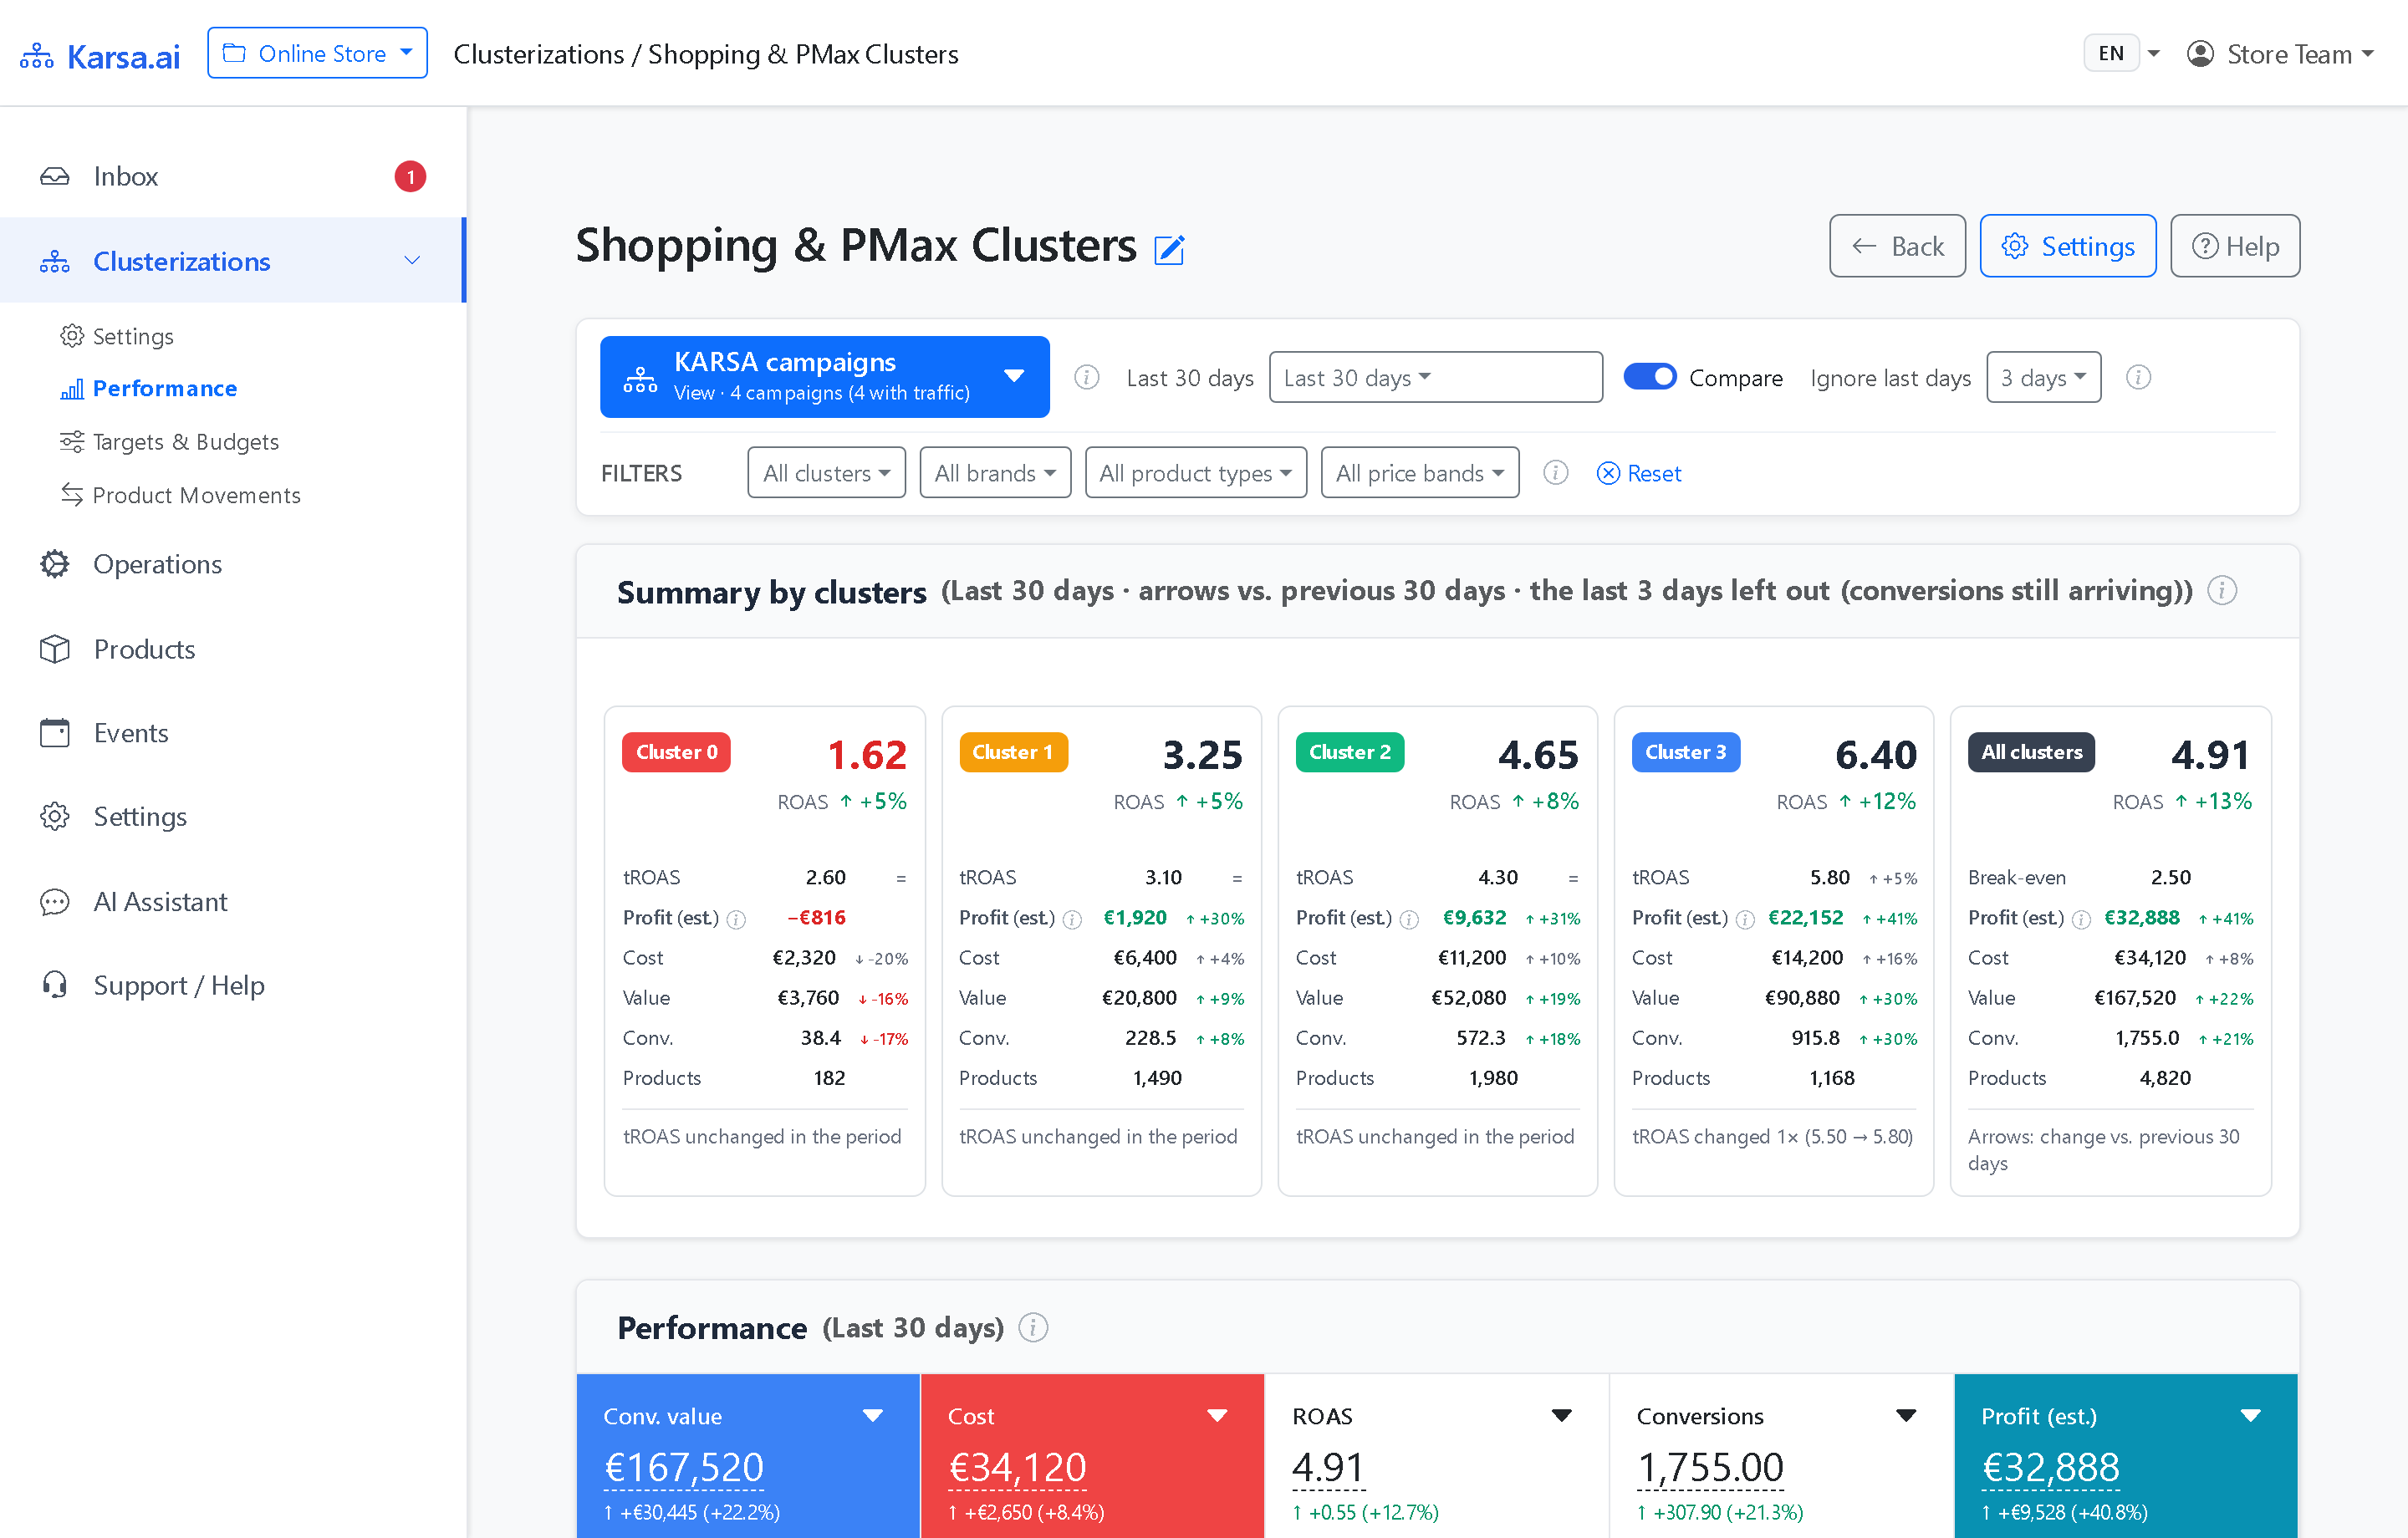
- Predictive Engine 9.3 cuts daily SKU moves by 31% to 51% on active production stores (42.5% fewer transitions in quarterly benchmarks).
- Boundary stability buffers, sparse-SKU evidence checks, and staggered post-move locks reduce 30-day reversals from 33.4% to 22.3%.
- Redesigned /Product catalog defaults to 30-day Profit sorting, loads top pages in roughly one second, and adds Peer Group Index 100.
- One-click UTF-8 CSV export for Excel plus [All | C0 | C1 | C2 | C3 | C4] and lag-adjusted [7d | 14d | 30d] filter pills.

Protecting Google Smart Bidding from noisy boundary flips (Engine 9.3)
Promoting a SKU on one lucky order only to demote it next week creates avoidable churn across Google Shopping campaigns.
Predictive Engine 9.3 strengthened Karsa.ai's movement stability across four safeguards:
- Sustained momentum scoring: Evaluates ongoing product trends rather than reacting to a single short-term spike.
- Boundary stability buffer: Keeps borderline SKUs steady inside their current cluster when variations stay within normal product fluctuation.
- Sparse-item evidence check: Requires clear historical support before moving low-volume SKUs while keeping a fast path for promising new arrivals.
- Staggered post-move lock: Spreads hold expiration across product IDs so relocated items settle cleanly without synchronized churn waves.
Upgrading active production stores cut daily SKU moves by 31% to 51% while maintaining internal cluster homogeneity. Across a 91-day benchmark on five seasonal datasets (three stores vs. Engine 9.1), total transitions dropped by 42.5% (29%–55% range). One-month reversals fell from 33.4% to 22.3% (−11.1 percentage points).
Redesigned /Product catalog, Peer Group Index, and CSV export
September's two portal updates also rebuilt the /Product catalog screen for fast operational audits:
- Default monthly Profit ranking: Opens straight to 30-day financial metrics sorted by net earnings, with fast pagination and case-insensitive offer-ID search.
- Cluster & window pills: Filter any catalog via
[ All | C0 | C1 | C2 | C3 | C4 ]buttons with live SKU counts. Switch[ 7d | 14d | 30d ]ranges omitting incomplete recent conversion lag. - Movement timeline & pricing table: Every SKU detail page displays cluster history and Peer Group Average (
Index 100). Historical price edits show7-daybefore-and-after conversions, value, and profit. - Spreadsheet export & notification controls: Download your filtered view as UTF-8 CSV (with BOM) in one click. Toggle automated digests via a global Master switch with per-report channel choices.
Frequently asked questions
How does Peer Group Average (Relative Index 100) work on the Product Detail page?
Each SKU is benchmarked against fellow items inside the same cluster (Index = 100). You see right away whether an offer outperforms or trails its campaign group.