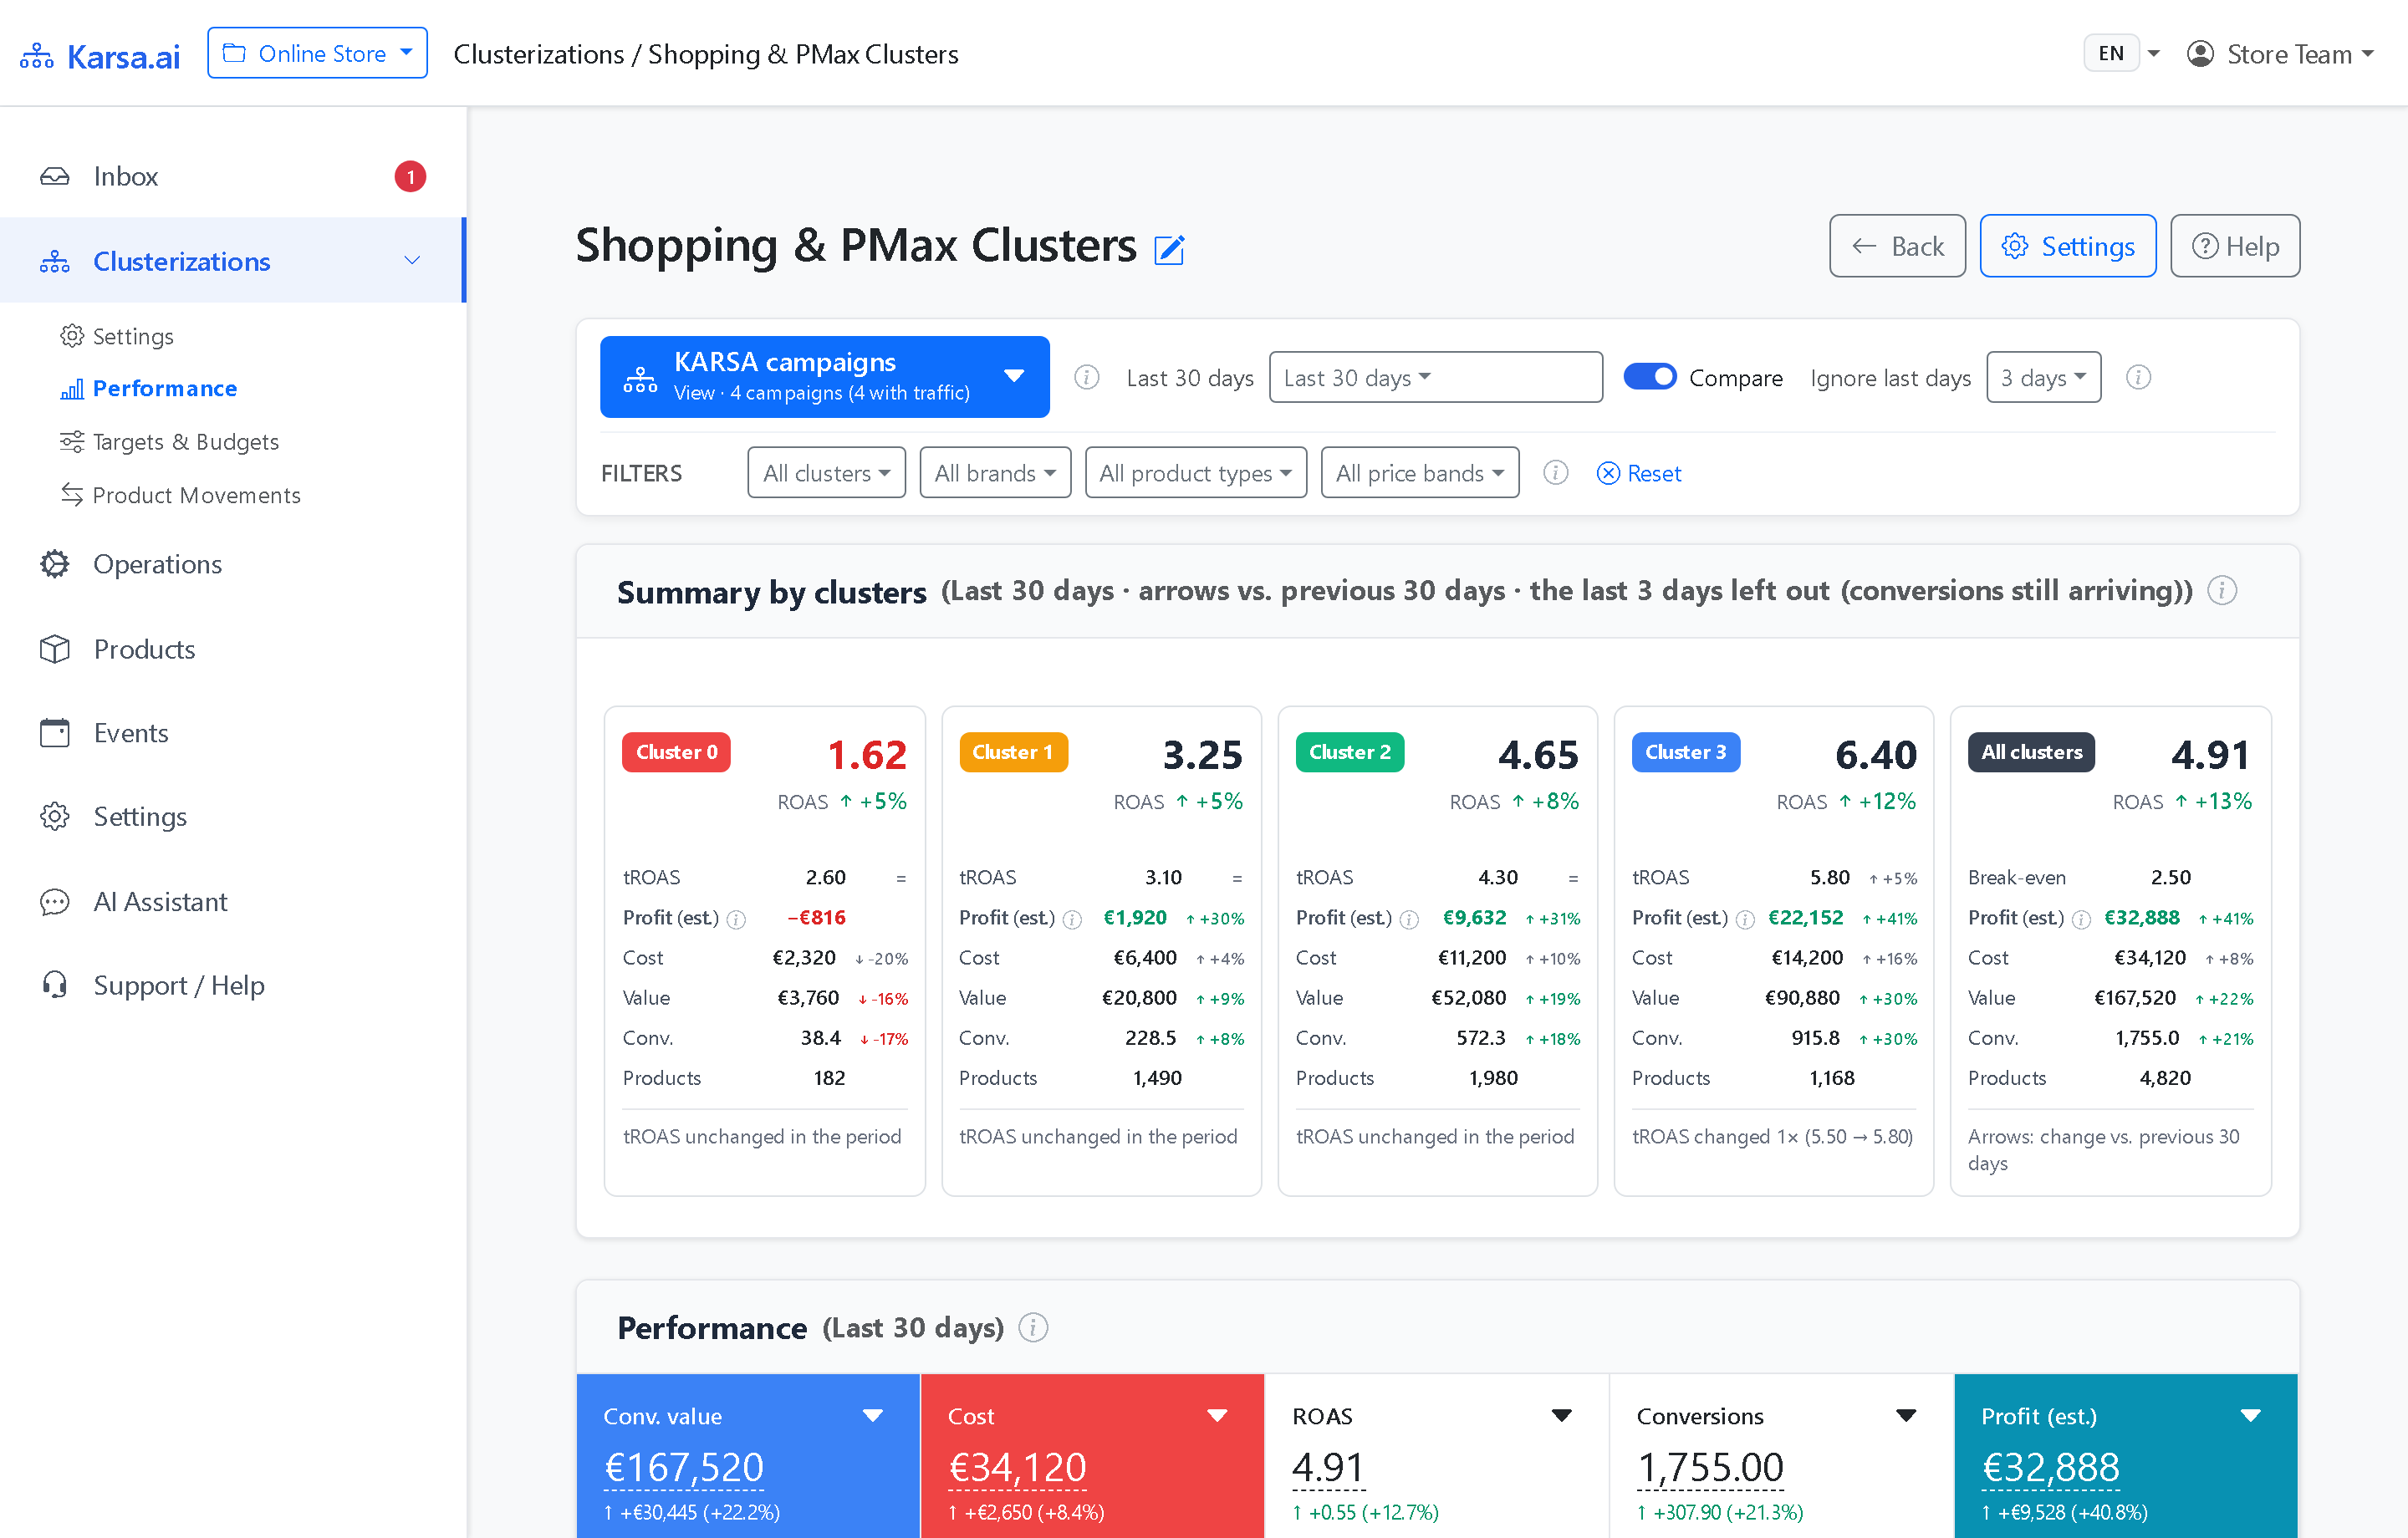
- Reconciles custom_label segmentation with Google's consolidation rule by targeting ≥30 monthly conversions per active cluster.
- Demonstrates with concrete SKU numbers why no single 14-, 30-, or 60-day lookback window fits mixed retail catalogs.
- Shows how PPC specialists audit predictions directly via 14-day post-move cohorts, Peer Group Index 100, and causal DiD.

Reconciling product segmentation with Google's consolidation guidance
Every senior PPC specialist knows both sides of the Shopping structure debate. Put 25,000 unequal SKUs into one Performance Max or Standard Shopping campaign, and one blended average hides severe internal dispersion. Top sellers hit daily budget ceilings early, while chronic non-converters absorb auction spend underneath profitable averages.
At the same time, Google's official Shopping documentation warns against over-fragmenting accounts. Google recommends running fewer, larger campaigns and states at least 15 conversions over 30 days as the baseline for Target ROAS bidding. Splitting a store into twenty tiny category or brand campaigns deprives Smart Bidding of conversion signal.
Segmentation only improves net earnings when two conditions hold together:
- Distinct economic levers: Each group genuinely requires its own
Target ROASand separate daily budget ceiling. - Sufficient conversion density: Every active campaign retains enough order flow for Google's auction bidding to calibrate reliably.
Most teams try to bridge that gap with trailing 30-day rule scripts or fixed four-bucket labelers. Understanding why backward-looking cutoffs break on multi-cycle catalogs clarifies where rule scripts suffice and where predictive segmentation takes over.
Why no single lookback window fits a multi-SKU retail catalog
A deterministic rule must pick a fixed lookback horizon, typically 14, 30, or 60 days. In a real catalog of 10,000+ SKUs, purchase cadence varies widely across product lines.
Take an illustrative example of four SKUs scored on Sunday night under a fixed rule (promote above 3.50 ROAS with ≥2 orders):
| SKU Pattern (Illustrative) | Last 14 Days | Last 30 Days | Last 60 Days | What Fixed Rules Do |
|---|---|---|---|---|
| 1. Everyday staple | 6 orders · 4.80 ROAS |
13 orders · 4.70 ROAS |
26 orders · 4.75 ROAS |
Classified accurately under any window |
| 2. Higher-ticket item (sells every ~38 days) | 0 orders · 18 cost |
0 orders · 42 cost |
2 orders · 5.60 ROAS |
14d and 30d rules hit an empty gap and demote a profitable item |
| 3. Ended summer item (peak finished 16 days ago) | 0 orders · 95 cost |
9 orders · 4.40 ROAS |
24 orders · 5.10 ROAS |
30d and 60d rules keep old peak revenue and overspend in top campaigns |
| 4. Rising seasonal item (demand started 5 days ago) | 2 orders · 4.90 ROAS |
2 orders · 2.90 ROAS |
2 orders · 2.10 ROAS |
30d and 60d rules dilute new momentum with pre-season clicks |
Shortening your script to 14 days catches seasonal turns faster, yet multiplies random empty windows on slower high-margin goods. Stretching the window to 60 days stabilizes sparse items, yet keeps yesterday's seasonal winners in aggressive campaigns long after demand stops.
Writing separate manual rules by price band, category, and season quickly turns into dozens of fragile thresholds. Karsa.ai replaces fixed lookback cutoffs with machine-learning models that predict product performance directly from your store's historical catalog behavior.
Technical comparison: lookback rule scripts vs. Karsa.ai
| Technical Dimension | Trailing Rule Scripts & 4-Bucket Labelers | Karsa.ai Predictive Segmentation |
|---|---|---|
| Classification Signal | Past clicks and realized trailing ROAS | Nightly ML prediction of product performance |
| Sales Cycle Handling | One fixed lookback window applied to every SKU | Adapts across steady, longer-cycle, and seasonal SKUs |
| Cluster Count & Density | Hardcoded at 4 buckets regardless of order volume | Dynamic active clusters + optional C0, calibrated around ≥30 monthly conversions per active group |
| Boundary Stability | Hard cutoffs (3.99 vs. 4.01 ROAS) trigger ping-pong |
Fluidity Manager controls transitions (31%–51% fewer daily moves in production) |
| Multi-Step Breakouts | Often locked to one adjacent bucket step or raw jumps | Direct multi-cluster jumps when justified, protected by staggered post-move locks |
| Margin & VAT Math | Static margin label or separate client-side GTM tags | 5 server-side profit modes + custom formulas ((CV / 1.21) * margin - cost) |
| Target ROAS Calibration | Manual trial and error across campaigns | Profit Target Calibration (PTC) statistical waves with conversion-lag hold gates |
Why margin buckets alone distort Smart Bidding signals
A second common shortcut groups products purely by gross margin (20%, 40%, 60%) and assigns each bracket its break-even Target ROAS. That setup solves accounting math while creating an auction mismatch.
Inside a 55% margin campaign, spare parts at a 0.15% conversion rate sit beside hero accessories converting at 4.2%. Smart Bidding still faces wide internal conversion-rate variance inside one campaign.
Karsa.ai separates auction grouping from profit accounting:
- Predicted product performance assigns each SKU to an active cluster (
C1,C2,C3…). Items inside one campaign share uniform expected auction strength. - Server-side SKU margins compute each cluster's live break-even ROAS floor, net profit after ad spend, conversion thresholds, and optional
C0isolation for chronic loss-makers.
How PPC specialists verify predictions inside the Portal
Relying on machine learning never means accepting unverified numbers. Every Karsa.ai project exposes four direct audit tools so specialists can test whether cluster assignments pay off:
- How do products react to a move? Compares per-SKU impressions, clicks, value, cost, ROAS, and profit across two weeks before versus after reassignment. The rightmost column nets results against peers remaining in the origin cluster.
- Do promotions pay off? Summarizes primary upward shifts into a transparent
Yes,Partly, orNoverdict using current SKU margins. - Peer Group Average (
Index 100): Benchmarks any individual SKU against fellow items inside its assigned cluster on the Product Detail screen. - Causal Difference-in-Differences (
BOM Impact): Evaluates production lift over a180-daybaseline with seasonal adjustment and Minimum Detectable Effect (MDE) checks.
Store sizing criteria: when rules suffice vs. when Karsa.ai fits
| Store Profile | Monthly Google Ads Conversions | Recommended Architecture |
|---|---|---|
| Under 500 active SKUs | Below 100 conversions |
Keep one consolidated Shopping / PMax campaign or a simple rule script. Splitting volume further hurts Smart Bidding. |
| 500 to 1,000 active SKUs | 100 to 200 conversions |
Borderline fit. Predictive clustering helps primarily when margins or seasonal turnover vary sharply across lines. |
| 1,000 to 500,000+ active SKUs | 100+ conversions (≥30 per active cluster) |
Primary Karsa.ai fit. Enough conversion density to separate top performers, mid-catalog items, and optional C0 loss-makers cleanly. |
Frequently asked questions
Does splitting a catalog into clusters conflict with Google's advice to consolidate campaigns?
Google advises running fewer, larger campaigns with at least 15 conversions in 30 days for Target ROAS. Splitting only helps when groups need distinct targets and budgets while keeping strong volume. Karsa.ai calibrates active cluster count dynamically around ≥30 monthly conversions per group.
When are simple 30-day Google Ads scripts or a single campaign sufficient?
Stores below 500 active SKUs or under 100 monthly conversions should keep one consolidated campaign or a basic rule script. Predictive clustering is built for catalogs of 1,000 to 500,000+ SKUs generating at least 100 monthly conversions.
Why not group products into campaigns purely by gross margin percentage?
Two items sharing a 55% margin can have 0.2% versus 4.0% conversion rates in auctions. Karsa.ai groups active clusters by predicted product performance for uniform bidding, while SKU margins govern break-even ROAS, net profit, and optional C0 isolation.