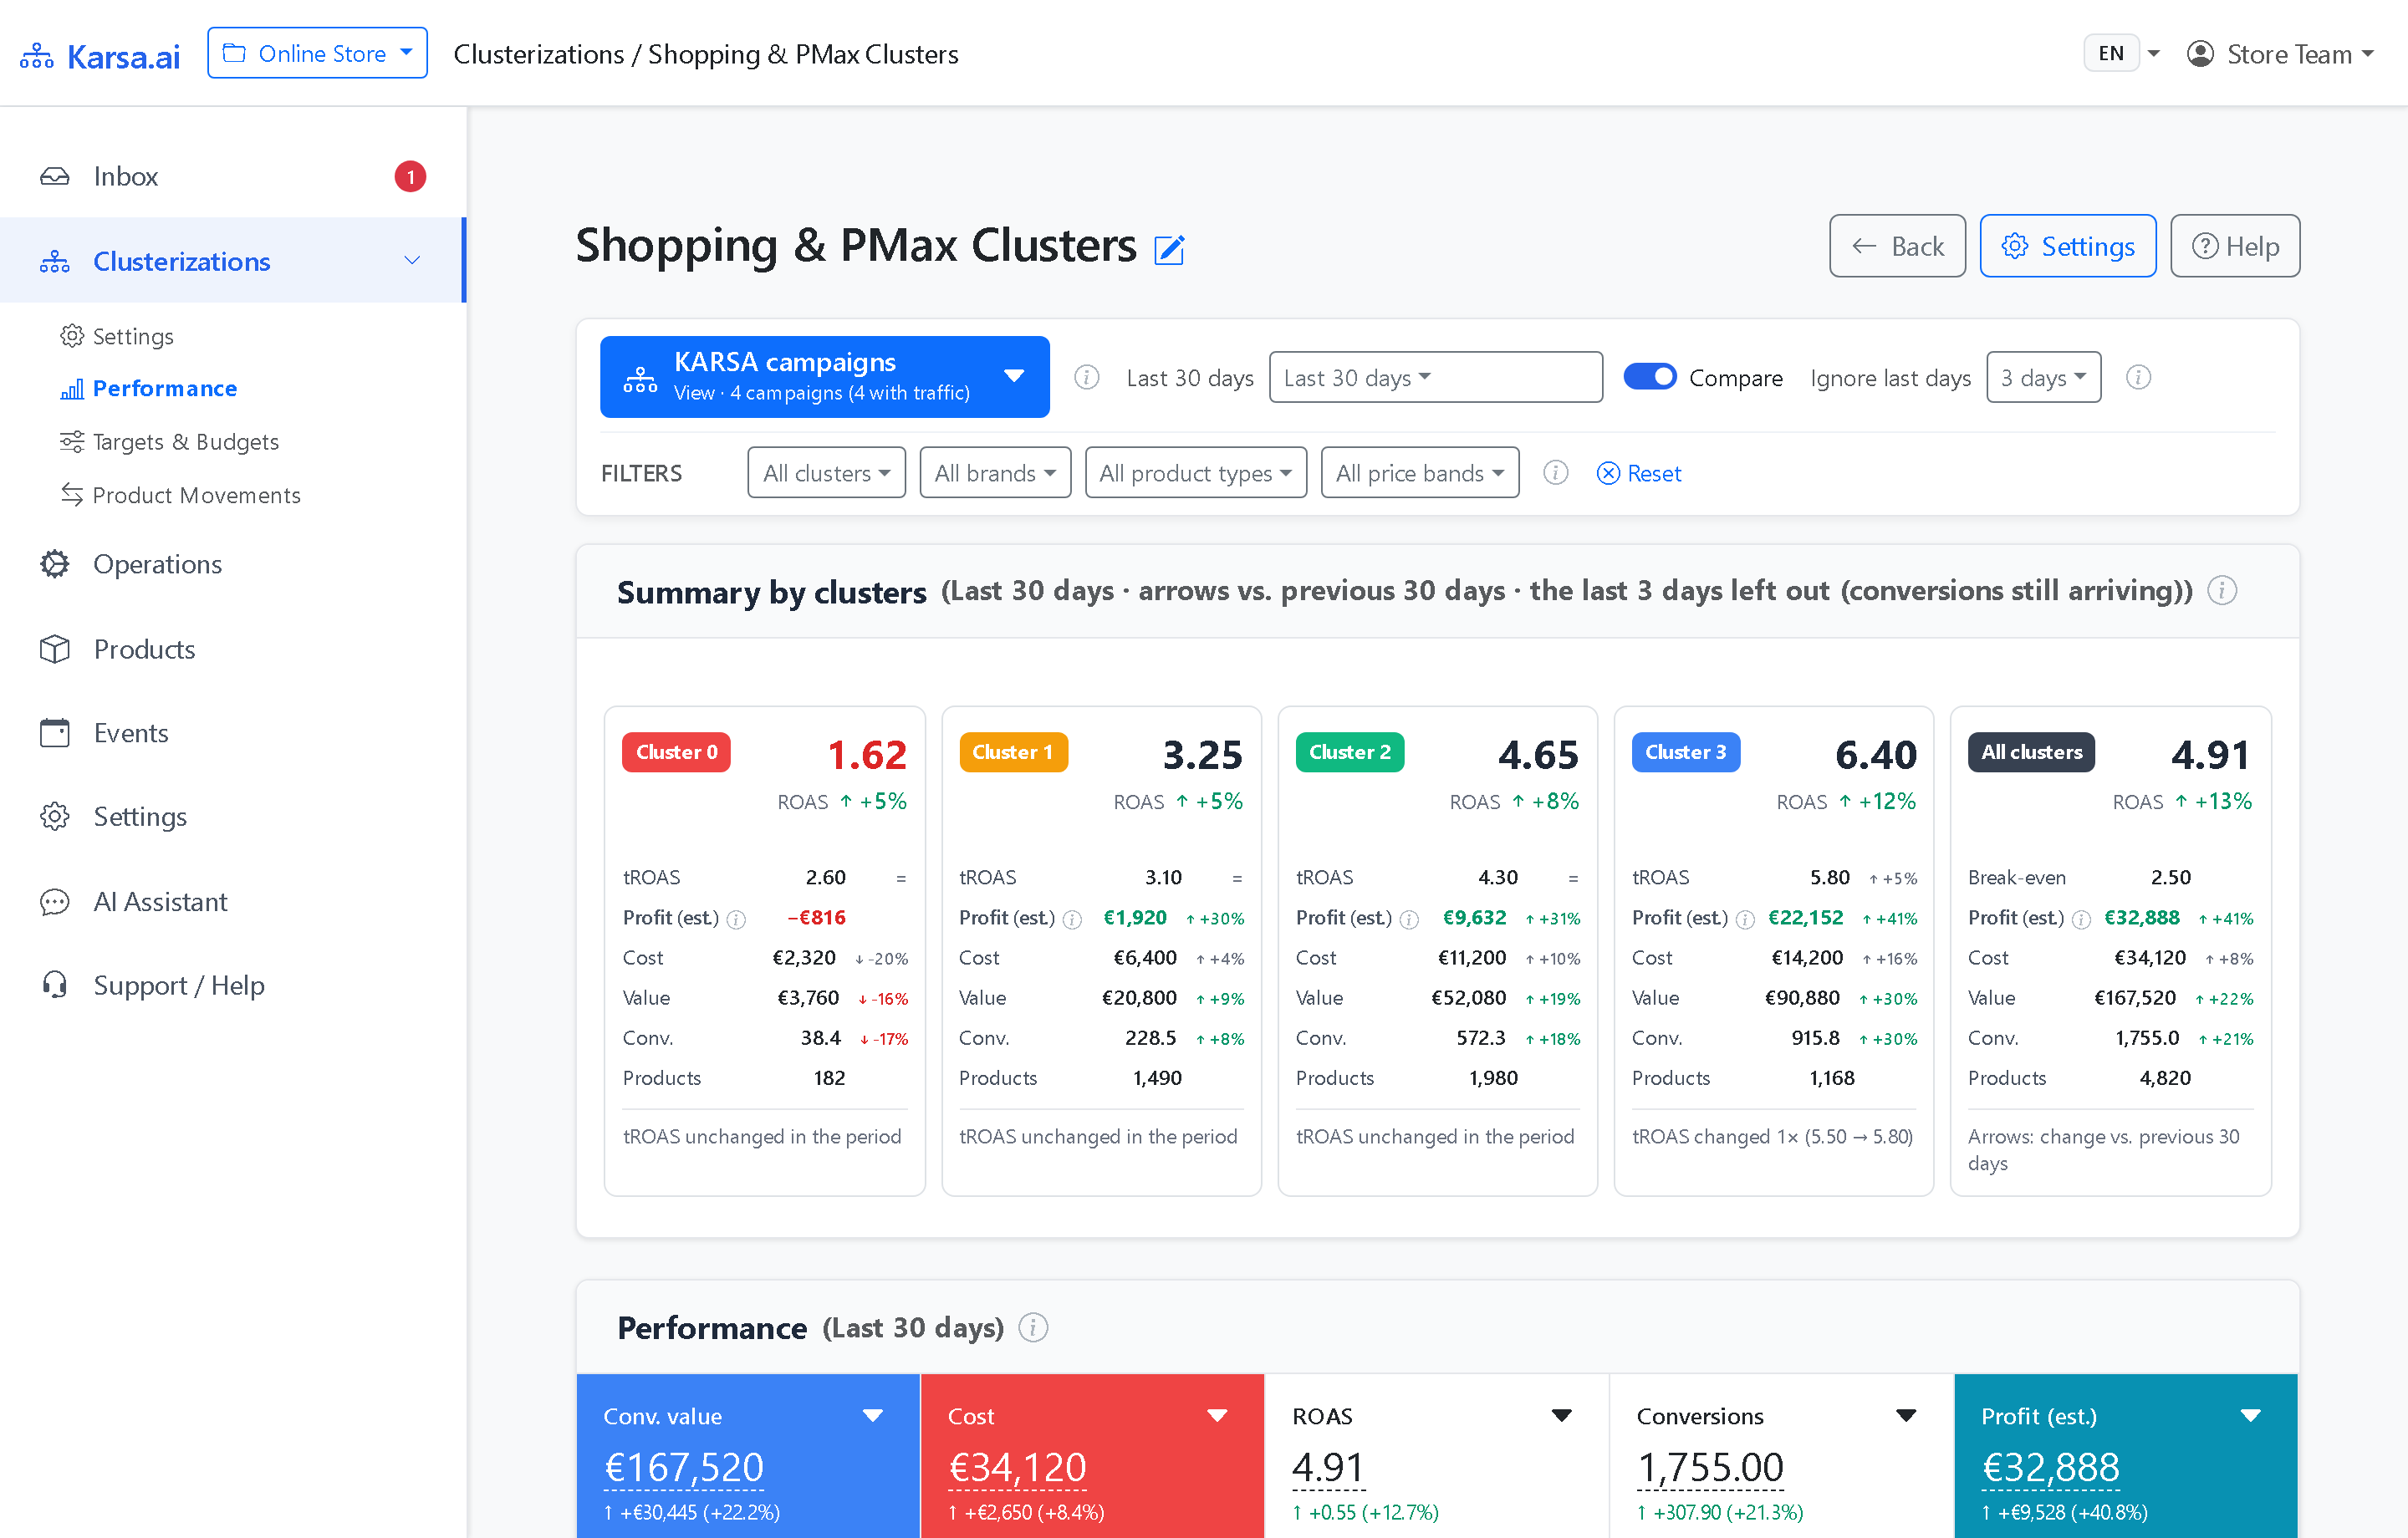
- Profit (est.) tile, per-cluster trend lines, and campaign net earnings columns across Performance and Targets & Budgets.
- Per-cluster Break-even ROAS floor lines derived from active SKU margins, plus a dedicated project override card.
- Five server-side profit modes with editable custom formulas, live Show Calculation preview, and Check Data coverage reports.
- AI extraction of up to 4 clean attributes (such as Material, Color, Target Group) from product titles for filtering and Composition.

(CV / 1.21) * margin - cost and run Check Data coverageWhy revenue ROAS alone hides real campaign profitability
Two clusters can report the exact same 3.40 ROAS in Google Ads while generating very different net earnings after COGS and VAT. November 2026 brings estimated net profit, custom equations, and break-even ROAS floors into cluster analytics without storefront GTM edits.
1. Profit (est.) and per-cluster Break-even ROAS across analytics
Once a margin mode is active for your project, Profit (est.) appears across the Karsa.ai Portal:
- Performance view: A fifth KPI tile (
Profit (est.)) displays net earnings, period comparison, and trend alongside Value, Cost, ROAS, and Conversions. Switching Lines: By cluster plots daily net profit per group. - Bidding view: Adds a Profit by cluster breakdown and campaign earnings columns. Each group's Break-even ROAS floor line renders right beneath active goals.
- Dedicated
Break-even ROASoverride: When revenue includes shipping, tax, or basket effects outside unit margins, set an explicit project floor in its own card. - Updated payoff verdict: Do promotions pay off? on Product Movements evaluates upward cohorts using trailing 30-day margins (
two weeksbefore versus after reassignment).
2. Five server-side profit modes & editable custom formulas
Under Settings → Profit Calculation, stores and agencies choose among five modes and edit the arithmetic equation (+ - * / ( )) with live preview:
| Calculation Mode | Primary Data Source | Default & Custom Formula Examples |
|---|---|---|
| Individual margins | CSV / TSV / TXT file upload or manual entry (unmapped SKUs inherit brand, category, product-type, or store averages) |
CV * margin - cost or (CV / 1.21) * margin - cost |
| Margins from the feed (New) | g:cost_of_goods_sold attribute in your primary XML feed (configurable with or without VAT) |
CV * margin - cost or (CV / 1.21) * margin - cost |
| Profit from Google Ads (New) | Native gross profit (GP) reported by Google Ads cart-data conversions |
GP - cost or GP / 1.21 - cost |
| Global margin | Single store-wide margin percentage | CV * margin - cost or (CV / 1.21) * margin - cost |
| Conversion value | Conversion value already representing profit / POAS | CV - cost or CV * 0.35 - cost |
For Margins from the feed and Profit from Google Ads, click Check data before switching. It verifies 30-day revenue coverage and offers a downloadable CSV issue report. Uploaded CSV / TSV / TXT files pass through a pre-import validator with Replace all stored margins or Only add and update options.
3. AI product title attributes: filter by Material, Color, or Target Group
Many Merchant Center feeds pack rich product traits (merino, softshell, carbon, kids) inside unstructured <title> strings while structured XML attributes stay empty.
Karsa.ai's language-model pipeline extracts up to four structured attributes from product titles across every project:
- Quick filters on Performance: Narrow charts and KPI tiles by extracted dimensions (
Material,Color,Category,Target Group) alongside Brand, Price Band, and Type. - Best and worst groups: Rank attribute cohorts by
Most profitorLeastto spot high-earning lines and unprofitable segments quickly. - Composition matrix: Under Product Movements, toggle Share of SKUs or Cost to view percentage breakdowns across
C0through your top active cluster.
Karsa.ai Portal views in this release
Click any screen below to inspect the full-resolution portal interface.


Frequently asked questions
Does adding SKU margins change how Karsa.ai groups products into clusters?
Karsa.ai assigns active clusters (C1, C2, C3… up to the highest group) by predicted product performance so Google Smart Bidding receives uniform signals. Margin data drives net profit reports, break-even floors, optional C0 protection, and Target ROAS calibration.
Do I have to expose cost_of_goods_sold to external ad tags in the browser?
No. Upload a private CSV/TSV/TXT file or read g:cost_of_goods_sold from XML on the backend. Margin figures stay inside Karsa.ai and never reach browser dataLayer scripts.